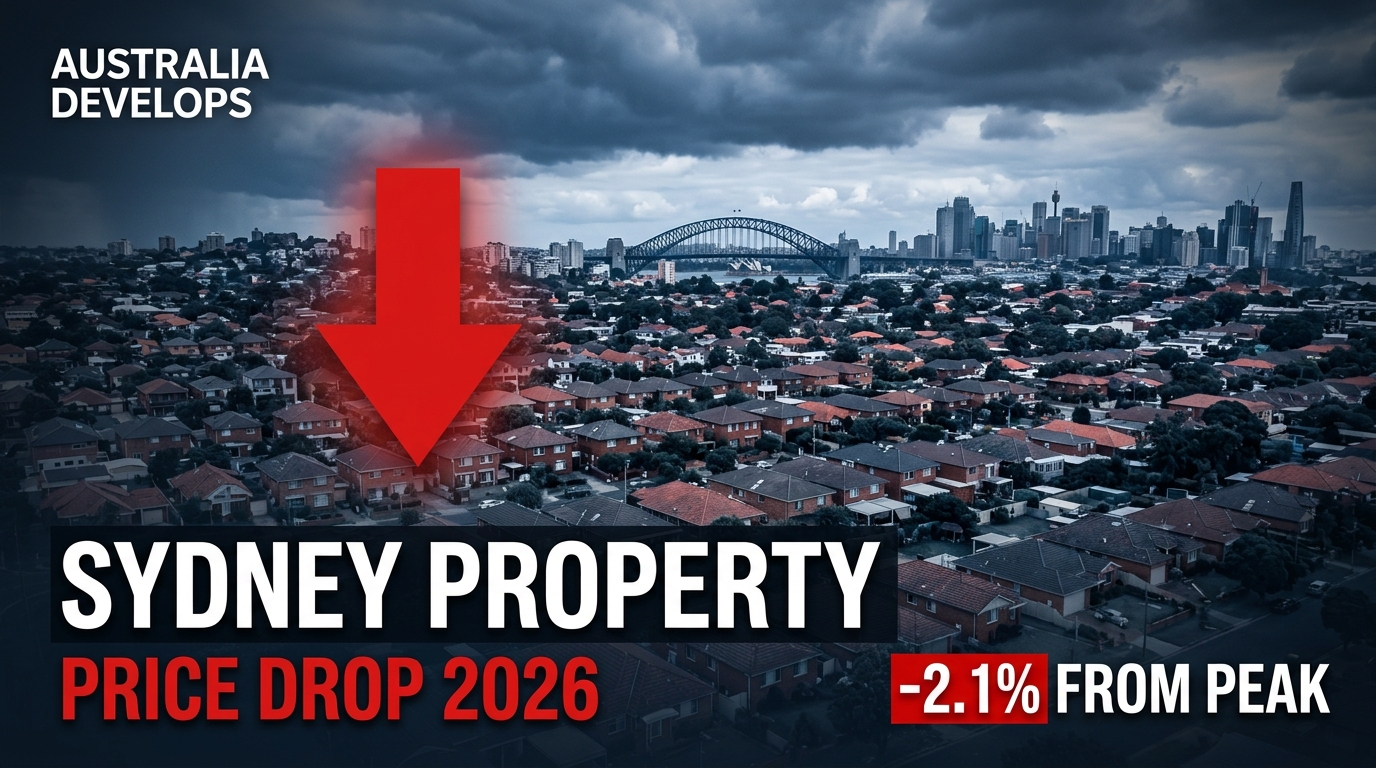
Australia’s two largest housing markets are in clear retreat. The Sydney property price drop 2026 has pushed values 2.1% below the November 2025 record high. Melbourne has declined further — sitting 3.2% below its March 2022 peak.
Cotality’s National Home Value Index recorded zero growth in May 2026. Indeed, that marked the market’s first genuine stall point in the current cycle.
Written by Daniel Whitfield, founder of Australia Develops, who has personally bought, subdivided, and built property across Australia.
The forces driving this shift, however, have been building for months. Moreover, higher borrowing costs, stretched affordability, and rising advertised stock have all eroded buyer capacity.
The Federal Budget’s proposed changes to negative gearing and capital gains tax concessions have added a new layer of uncertainty.
This analysis draws on June 2026 Cotality data, ANZ Research forecasts, and CBA economic modelling to map where values are falling, which areas are holding firm, and what the data indicates about timing.
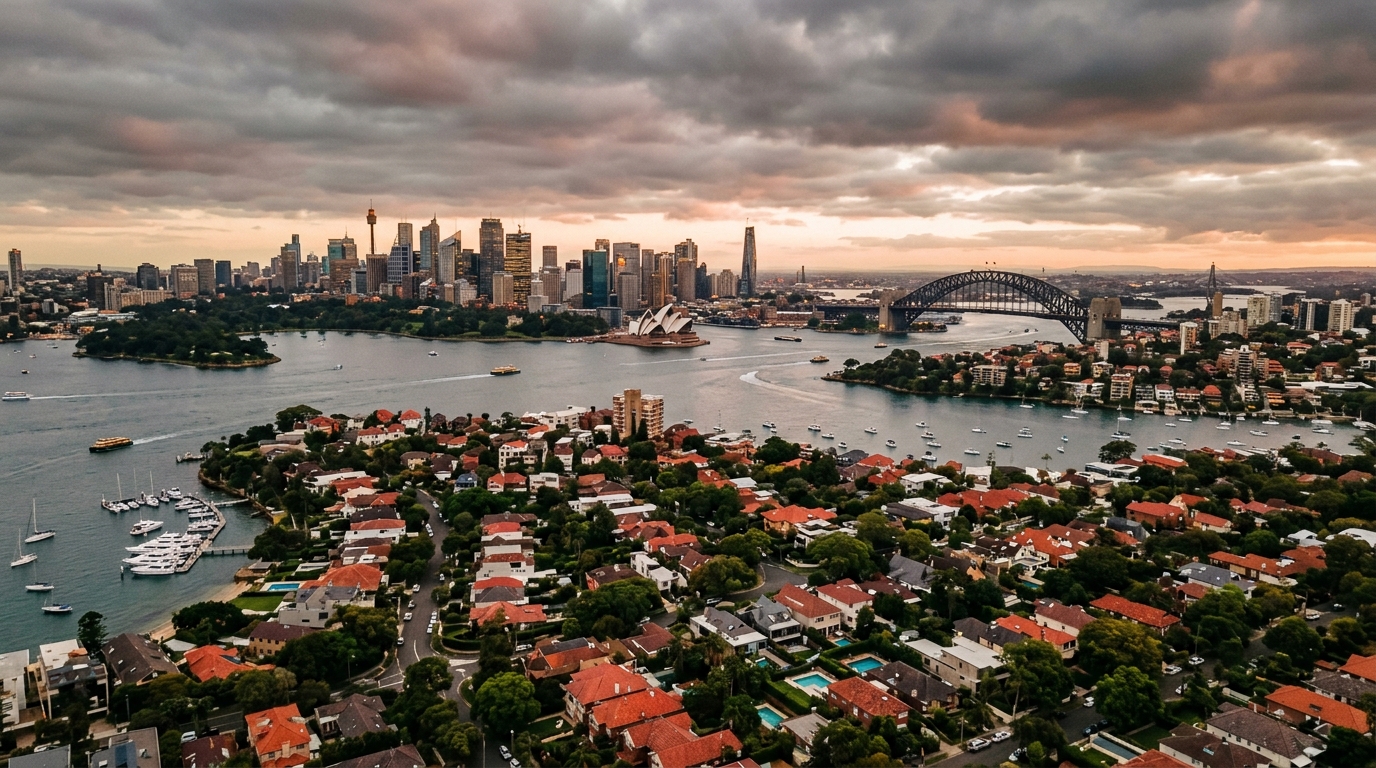
How Far Have Sydney and Melbourne Prices Fallen?
The Sydney property price drop has pushed Sydney values 2.1% below the November 2025 peak, shedding approximately $28,000 from the median in a matter of months. Melbourne has declined 3.2% from its March 2022 record high.
The chart below compares the scale of decline across the two largest capital city markets.
| Capital City | Monthly Change (May 2026) | From Peak | Key Notes |
|---|---|---|---|
| Sydney | −0.9% | −2.1% from Nov 2025 | Median shed ~$28,000 |
| Melbourne | −0.8% | −3.2% from Mar 2022 | Upper quartile houses −1.3% in May |
| Canberra | −0.2% | Softening | Second consecutive monthly fall |
| Brisbane | +0.9% | Slowing | Down from 2.0% monthly peak (Oct 2025) |
| Adelaide | +0.5% | Moderating | Smallest gain since June 2025 |
| Perth | +1.5% | Still leading | 5-year cumulative gain: 91.4% |
| Darwin | +1.5% | Momentum intact | Rolling quarterly gain: 5.2% |
Source: Cotality Home Value Index, June 2026
The decline, furthermore, has spread well beyond premium properties. Additionally, affordable lower price tiers in Sydney, Melbourne, and Canberra are now also recording falls.
Auction clearance rates across the combined capitals have settled around 50% — a level that historically favours buyers over sellers.
Sydney’s estimated home sales over the three months to May 2026 were tracking 17% below the same period in 2025. Melbourne’s figure was 14% lower year-on-year. Nationally, sales activity is running 2.2% below the five-year average.
Which Sydney and Melbourne Suburbs Are Falling Hardest?
Inner premium suburbs in both cities have recorded the steepest declines from their individual peaks, with several locations down more than 15%.
| Suburb | City | Segment | Decline from Individual Peak | Approx. Median |
|---|---|---|---|---|
| Terrey Hills | Sydney — Northern Beaches | Houses | −22.3% | ~$2.7M (from $3.5M peak Oct 2021) |
| Kensington | Sydney — Inner East | Houses | −15.1% | N/A |
| Bronte | Sydney — Eastern Suburbs | Houses | −13.8% | N/A |
| Fairfield | Melbourne — Inner North-East | Houses | −21.4% | $1,122,500 |
| South Melbourne | Melbourne — Inner South | Houses | −21.1% | $1,200,000 |
Sources: Domain.com.au; Yahoo Finance/Cotality suburb data, mid-2026
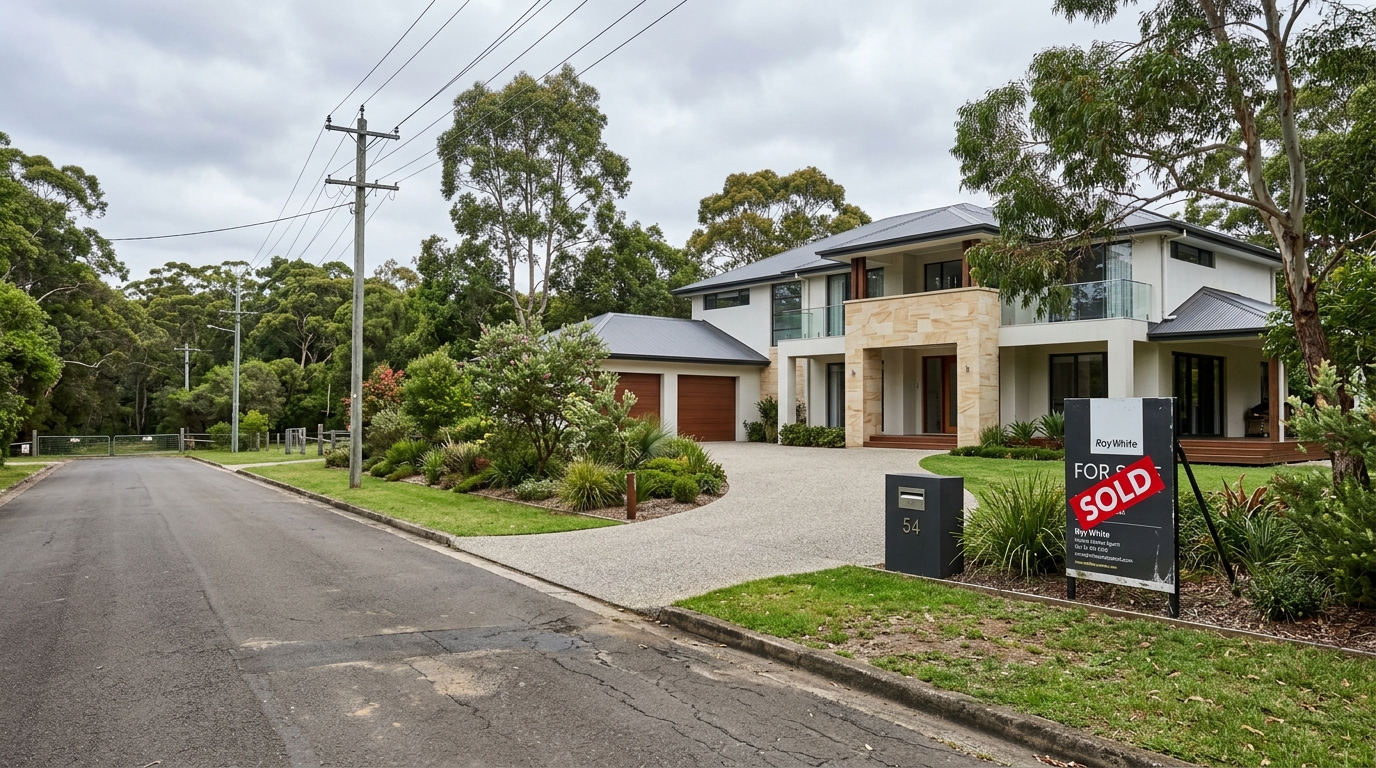
This pattern is evident in premium Northern Beaches suburbs such as Terrey Hills, where recent sold listings confirm the scale of the pullback. The table below breaks down the sharpest suburb-level declines across Sydney and Melbourne.
Suburb-level declines vary sharply between premium Sydney and Melbourne markets.
Suburbs with largest declines from peak — Sydney & Melbourne
Mid-2026 · Source: Domain, Cotality, Yahoo Finance
Terrey Hills
Sydney – Northern Beaches
−22.3%
Median ~$2.7M
Fairfield
Melbourne – Inner NE
&minus:21.4%
Median $1.12M
South Melbourne
Melbourne – Inner
−21.1%
Median $1.20M
Kensington
Sydney – Inner East
−15.1%
Median data limited
Bronte
Sydney – Eastern Suburbs
−13.8%
Median data limited
This pattern follows a consistent cycle. Indeed, premium suburbs typically lead downturns because high-value properties are most sensitive to changes in borrowing costs and serviceability limits.
Inner Melbourne’s correction is deeper than Sydney’s in percentage terms, reflecting the fact that Melbourne peaked earlier and has had longer to adjust.
It is critical to note the distinction between individual suburb peaks and the broader index. The combined Sydney market is down 2.1% from the November 2025 cycle peak — not 22%.
Terrey Hills’ 22.3% figure measures movement from the suburb’s own October 2021 record high, which was set more than four years ago during the pandemic-era peak.
Western Sydney — Why the Outer Growth Corridors Are Holding Up
Outer western Sydney suburbs are significantly outperforming the broader market, with Penrith recording 11.7% annual growth and St Marys at 11.6% — both ranking among the top-performing suburbs nationally in May 2026.
This resilience is not coincidental. The Western Sydney International Airport, scheduled to open in late 2026, has sustained demand across the Bringelly, Badgerys Creek, and Oran Park corridors.
The Western Sydney Aerotropolis covers approximately 11,200 hectares of rezoned employment land — providing a structural demand floor in the fringe growth belt.
Aerotropolis precinct land banking has accelerated through 2026, with multiple institutional developers holding sites across the employment and enterprise zones.
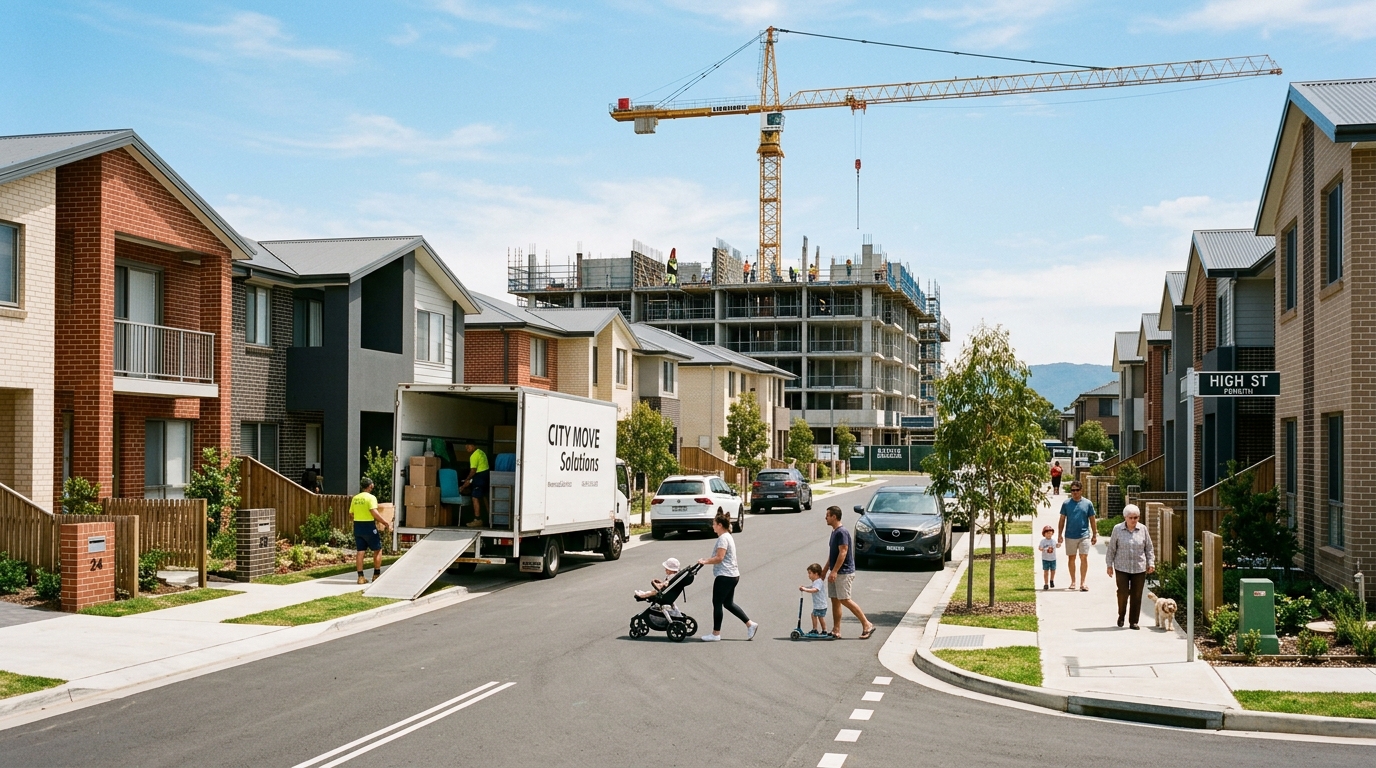
The construction pipeline across the South West Growth Area remains active. The Leppington development corridor is tracking several hundred lot registrations per quarter. The Bringelly and Birling Estate pipeline continues to advance through planning approvals.
Bankstown’s $3.9 billion in active development projects — spanning the metro-linked hospital, commercial towers, and residential buildings — reflects the depth of capital commitment within the inner-Western Sydney catchment.
Institutional investment infrastructure in Western Sydney also distinguishes the region from the broader market. Baring Real Estate Australia and Aware Super have co-funded mixed-use projects across the corridor.
Transport for NSW’s M12 Motorway and Sydney Metro Airport line provide the connectivity backbone that underpins long-term demand.
The Austral Precinct — covering 2,455+ registered lots — illustrates how structured lot supply absorbs demand even during a broader city-wide softening period.
The Rental Market: Yields Rising While Prices Fall
The national rental vacancy rate fell to 1.5% in May 2026 — back at record-low levels — while annual rent growth accelerated to 5.9%, the strongest pace since September 2024.
| Rental and Yield Metric | Data (May–June 2026) |
|---|---|
| National Rental Vacancy Rate | 1.5% — record-low territory |
| Annual Rent Growth (National) | 5.9% — strongest since Sept 2024 |
| Combined Capitals Gross Rental Yield | 3.45% — highest since mid-2025 |
| Darwin Gross Rental Yield | 6.0% — highest of any capital |
| Renter Housing Cost Burden | ~33% of gross household income |
| Investor Share of New Mortgages | ~40% (March 2026 quarter) |
Source: Cotality, June 2026. See also: PropertyUpdate / Tim Lawless national market analysis.
Commercial real estate yields in the Western Sydney corridor are tracking above the 3.45% combined capitals residential average.
Industrial vacancy across the Aerotropolis Employment Zone sits below 1%, reflecting the tightest leasing conditions of any major industrial precinct in greater Sydney.
The federal budget has introduced material uncertainty. The proposed amendments to negative gearing deductions and the capital gains tax discount concession are expected to be legislated in the second half of 2026.
A measurable pullback in investor activity in the established housing market is widely anticipated.
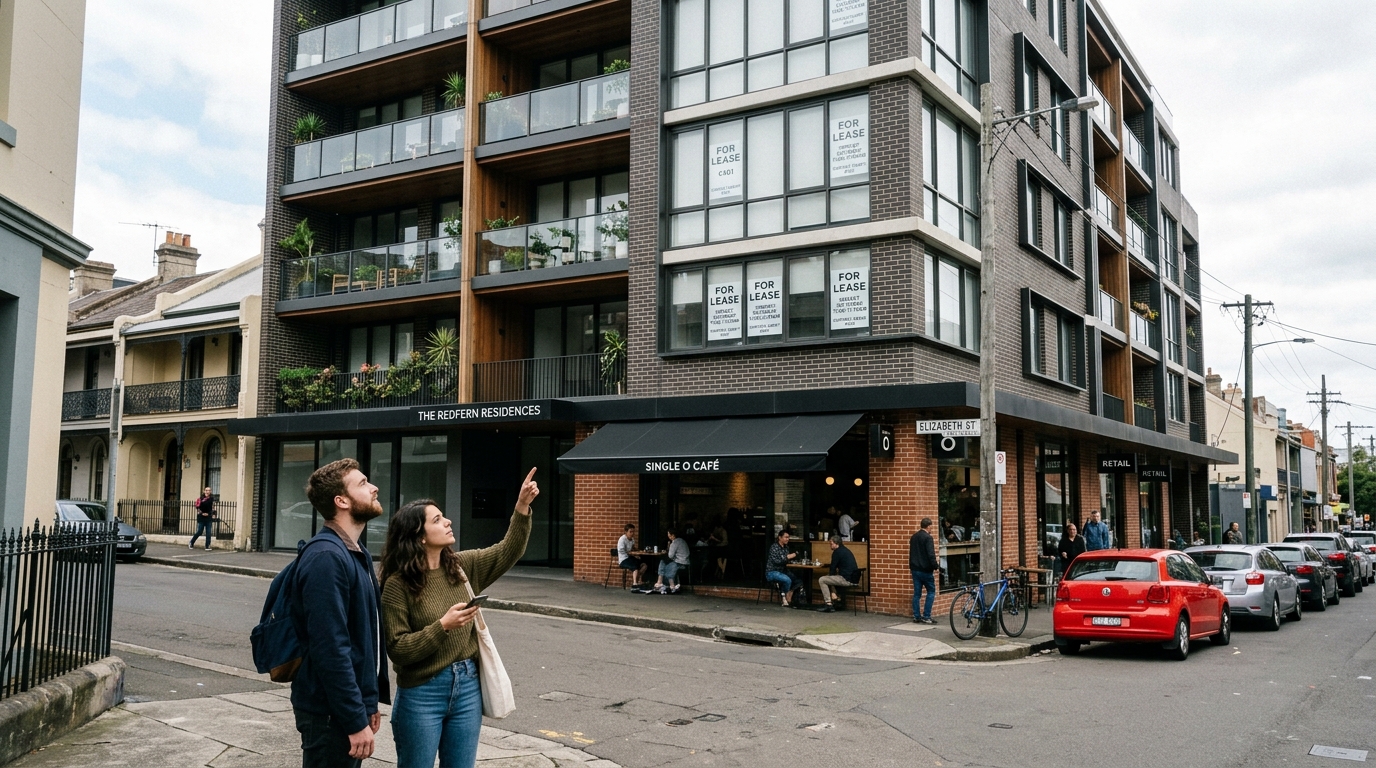
Foreign Direct Investment (FDI) Australia benchmarks indicate continued offshore capital interest in Australian industrial and logistics assets — a partial counterweight to the expected retreat of domestic investors from residential markets.
For investors holding dual occupancy or granny flat developments, the rental yield equation remains more favourable than for standard single dwellings, given the dual-income structure.
When Will the Sydney Property Price Drop End?
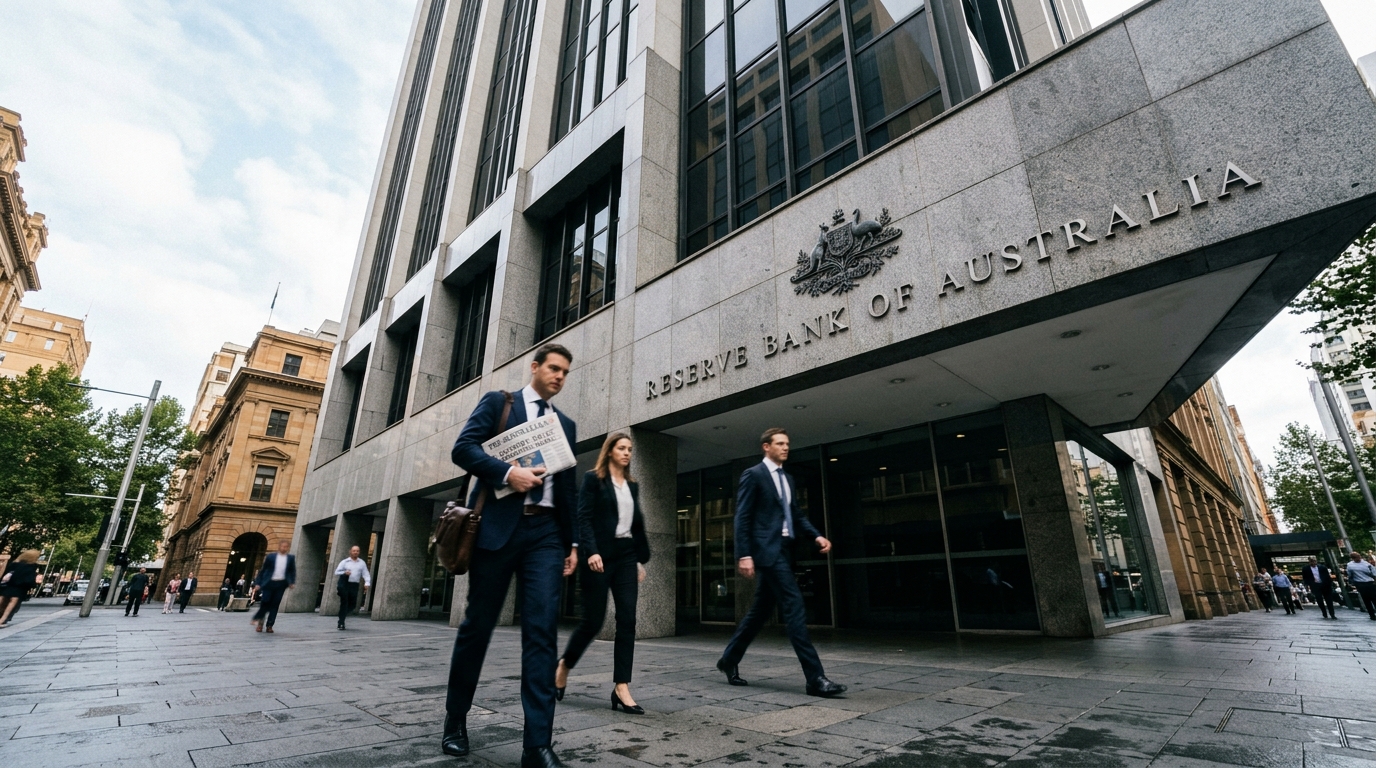
ANZ Research forecasts Sydney to finish 2026 approximately 0.7% below where it started. The Sydney property price drop is expected to moderate through H2 2026 as rate-cut expectations build.
Melbourne is forecast down 1.7% for the full calendar year. Both ANZ and CBA analysts point to early 2027 as the expected turning point.
The timeline below traces the cash rate path underlying the price-recovery timing.
| Institution | Sydney Full-Year 2026 Forecast | Melbourne Full-Year 2026 | First Rate Cut Forecast |
|---|---|---|---|
| ANZ Research | −0.7% | −1.7% | 2027 |
| CBA Economics | Soft H2 2026 | Soft H2 2026 | May 2027 |
| Westpac IQ | Nationally flat | Nationally flat | Mid-2027 |
Sources: ANZ BlueNotes April 2026; CommBank Newsroom June 2026; Australian Property Update
RBA Rate Path and the Recovery Timeline
The Reserve Bank of Australia held the cash rate at 4.35% through June 2026. CBA economists have forecast the first cut for May 2027, with a second reduction in August 2027.
The expectation is that renewed affordability — through lower mortgage servicing costs — will be the primary trigger for a sentiment shift. Historical data from Cotality’s 40-year index provides important context.
The largest peak-to-trough decline across the combined capitals over that entire period was 8.2%. Therefore, even a sustained correction through to early 2027 is unlikely to approach the severity of sharp downturns seen in other international markets.
Structural supply constraints remain firmly in place. The national vacancy rate at 1.5% confirms that housing supply is critically tight relative to population demand.
The labour market has also remained resilient through the rate-hiking cycle, preventing the forced-selling pressure that amplifies housing downturns.
For owners in the granny flat CDC and secondary dwelling pipeline, the rental income position has actually strengthened during the downturn, as vacancy tightens and rents continue rising.
WSI’s 24-hour curfew-free operations are expected to generate sustained employment demand around the airport precinct — providing demand support in the corridors most exposed to the new transport node.
Sydney Property Price Drop 2026 — Key Data at a Glance
| Metric | Data |
|---|---|
| Sydney decline from November 2025 peak | −2.1% (~$28,000 median) |
| Melbourne decline from March 2022 peak | −3.2% |
| National HVI change (May 2026) | 0% (first stall of current cycle) |
| Hardest-hit Sydney suburb (from suburb peak) | Terrey Hills −22.3% to ~$2.7M |
| Hardest-hit Melbourne suburb (from suburb peak) | Fairfield −21.4% to $1,122,500 |
| Top-performing Sydney suburb (annual) | Penrith +11.7% |
| National rental vacancy rate | 1.5% — record-low |
| Annual national rent growth | 5.9% |
| Combined capitals gross rental yield | 3.45% |
| Sydney home sales (3-month, vs year ago) | −17% |
| Melbourne home sales (3-month, vs year ago) | −14% |
| Combined capitals auction clearance rate | ~50% |
| Sydney full-year 2026 forecast (ANZ) | −0.7% |
| Melbourne full-year 2026 forecast (ANZ) | −1.7% |
| Forecast market bottom | Early 2027 (ANZ, CBA) |
| First RBA rate cut forecast | May 2027 (CBA) |
| Historical max peak-to-trough (40-year record) | −8.2% combined capitals |
Sources: Cotality June 2026; ANZ Research; CBA Newsroom; Westpac IQ
Frequently Asked Questions
The following questions address the most common concerns about the 2026 Sydney and Melbourne property price correction.
How much have Sydney property prices fallen in 2026?
Sydney dwelling values have fallen 2.1% from their November 2025 peak, equivalent to roughly $28,000 off the median dwelling value. Melbourne has fallen further, down 3.2% from its March 2022 peak.
Which suburbs are falling hardest?
Premium and inner-ring suburbs such as Terrey Hills on the Northern Beaches have recorded the steepest declines, while outer growth corridors in Western Sydney have proven comparatively resilient.
Why are rental yields rising while prices fall?
National rental vacancy hit a record low of 1.5% in May 2026, pushing annual rent growth to 5.9%, the strongest pace since September 2024. Consequently, tightening rental supply has kept yields climbing even as sale prices soften.
When will the Sydney property price drop end?
The RBA held its cash rate at 4.35% through June 2026. CBA forecasts the first rate cut in May 2027 and a second in August 2027, which is expected to mark the turning point for the market.
Rezoning may support selected station precincts during the wider price correction. The TOD Rezoning NSW 2026 guide identifies the affected stations and development controls.
Summary
The Sydney property price drop 2026 represents an orderly market correction rather than a structural collapse. Sydney is 2.1% below its November 2025 peak and Melbourne has declined 3.2% from its earlier high.
The scale of falls varies enormously across price tiers, property types, and locations — and the city-wide index figures mask significant variation at the suburb level.
The clearest divergence is between inner premium markets and outer growth corridors. Inner Sydney and inner Melbourne suburbs, particularly those at the $1.5M+ price point, have recorded double-digit declines from their own pandemic-era peaks.
Western Sydney’s airport and aerotropolis-driven corridors — Penrith, St Marys, Leppington — are recording some of the strongest annual gains in the country, underpinned by infrastructure delivery and structural employment demand.
The summary below distills the key signals behind the 2026 price correction.
The rental market signals confirm that the underlying supply-demand imbalance that has defined Australian housing for years has not resolved.
A vacancy rate of 1.5% and rents growing at 5.9% annually mean that the pressure on housing affordability is intensifying from the rental side, even as purchase prices soften.
The key variable to watch remains the RBA. CBA’s May 2027 forecast for the first rate cut represents the most significant near-term catalyst for a confidence shift in the Sydney and Melbourne markets.
For further context on the infrastructure driving Western Sydney growth, see the full Western Sydney Aerotropolis 2026 analysis.
This article is for informational purposes only and does not constitute financial, investment, or legal advice. Seek independent professional advice before making any property decisions.
This article is general information only and is not financial, legal or planning advice. See the Disclaimer for details.