Australian house prices by capital city have split into two camps in 2026. Over twelve months, Darwin, Perth, Hobart, Adelaide and Brisbane still sit well ahead. But Sydney, Melbourne and Canberra have gone backwards. September brought something new. Every capital except Darwin fell in the same month. Then the Reserve Bank lifted the cash rate for the fourth time this year. So here is the latest scorecard, what the three main data sources say, and what to watch into 2027.
This article was produced and reviewed by the Australia Develops editorial team. See our Editorial Policy for sourcing standards and methodology.
Australian house prices by capital city: the September 2026 scorecard
The Cotality Home Value Index (formerly CoreLogic) fell 1.1% nationally in September. That makes six straight monthly falls. National values now sit 5.2% below the record high from March 2026, and they’re flat over the year at 0.0%. The national median value is $899,236. Note that the index covers houses and units together, so treat it as a dwelling measure.
Here is how each capital finished September, according to Cotality’s results to 30 September:
- Darwin: up 0.4% for the month and up 11.9% over the year. Median $633,431.
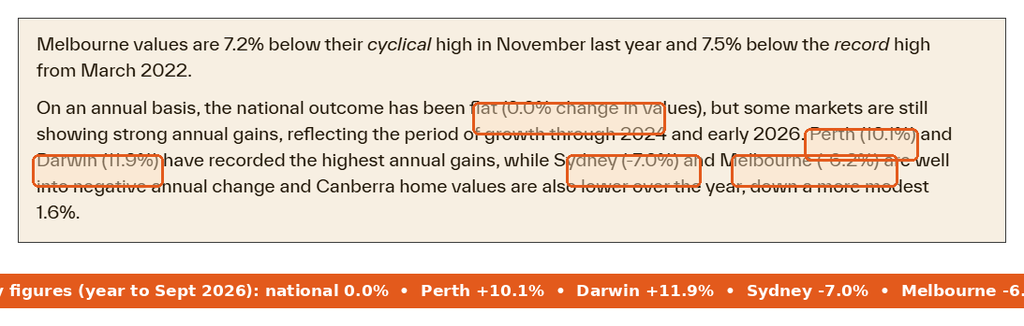
- Perth: down 1.2% for the month, but still up 10.1% over the year. Median $975,022.
- Hobart: down 0.5% for the month, up 7.0% annually. Median $741,496.
- Adelaide: down 1.3% for the month, up 6.5% annually. Median $928,560.
- Brisbane: down 1.5% for the month, up 5.9% annually. Median $1,048,880.
- Canberra: down 1.1% for the month and down 1.6% annually. Median $861,744.
- Melbourne: down 0.7% for the month and down 6.2% annually. Median $780,550.
- Sydney: down 1.4% for the month and down 7.0% annually. Median $1,198,596.
Which capitals are still ahead, and which have stalled
Darwin stands alone right now. It was the only capital to rise in September, and it sits just 0.2% below its July 2026 peak. Perth, Adelaide, Brisbane and Hobart are still well up on a year ago. Yet the monthly numbers tell you that run has stopped. Brisbane actually posted the sharpest monthly fall of any capital at 1.5%, edging past Sydney’s 1.4%.
At the other end, Sydney now sits 8.6% below its February peak. Cotality says that decline is marginally deeper than the same stage of the 2022-23 downturn. Melbourne is 7.2% below its cyclical high from November last year, and 7.5% below its March 2022 record. Canberra is down too, though more gently.
So the old “rising vs flattening” split has changed shape. Today the real divide is how much of last year’s gain each capital still has in hand. If you want the Sydney detail suburb by suburb, it is covered in the Sydney property price drop breakdown.
PropTrack and the ABS tell a similar, softer story
PropTrack’s index also fell for a sixth month, but by less. National prices slipped 0.2% in September, so they’re up just 0.1% on a year ago and 3.3% below the March peak. Its capital city results are milder than Cotality’s, though the ranking is close. Darwin rose 0.1% (up 12.0% annually) while Adelaide fell 0.6%. Over the year, Perth is up 6.7%, Adelaide 5.6% and Brisbane 4.1%. By contrast, Sydney is down 5.0% and Melbourne 5.2%.
Then there’s the ABS. Its Total Value of Dwellings release for the June quarter showed the first fall in dwelling stock value since September 2022. The total dropped $34.1 billion to $12,688.9 billion. The mean dwelling price fell $8,200 to $1,100,400.
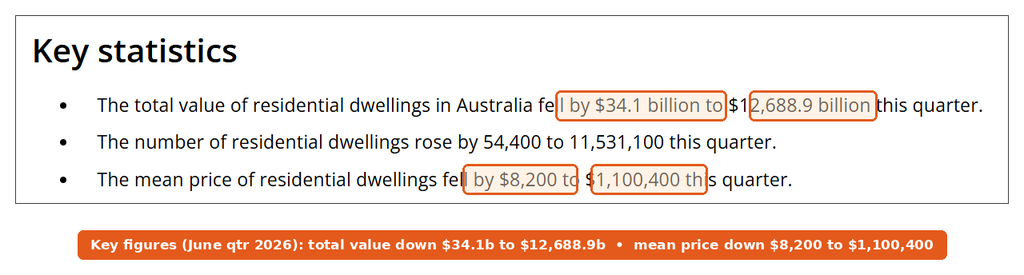
The state split matches the private indexes. The mean price fell $32,700 in NSW, $19,600 in Victoria and $13,300 in the ACT. Every other state and territory rose, with WA up $24,500 and Queensland up $15,800. Still, keep in mind the ABS covers whole states, not just capitals. It’s also a quarter behind, because it measures the period to June.
How the RBA’s 2026 rate rises hit Australian house prices by capital city
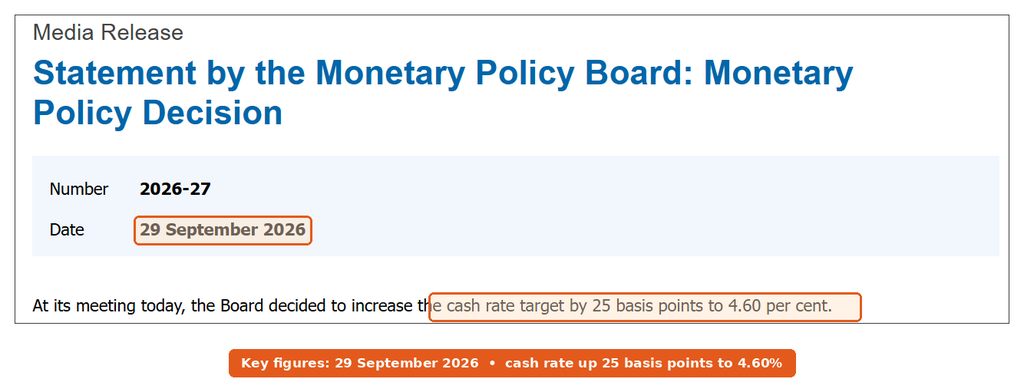
The cash rate finished 2025 at 3.60%. Then the RBA reversed course with rises in February, March and May. On 29 September, the board lifted the cash rate target by 25 basis points to 4.60%. That’s a full percentage point in one year. The board’s statement points to higher energy prices from the Middle East conflict, and inflation that came in stronger than it expected.
The statement also names housing directly. It says “housing prices have fallen in most capital cities and new housing loans have declined noticeably”. So the RBA can see the downturn, but it still chose to tighten. It even flagged “uncertainties about the economic effects of the downturn in the housing market”.
The link to prices runs through borrowing power. PropTrack’s Eleanor Creagh put it plainly. “Higher interest rates are weighing on borrowing capacity and buyer demand.” Lenders also assess you at a buffer above your actual rate. That means each rise cuts the maximum loan by more than the repayment change alone suggests.
Sales, listings and days on market
Prices are only half the picture. Cotality says sales over the past three months ran 19.1% below a year ago nationally. That’s also 13.3% under the five-year average. Brisbane volumes fell hardest at 27.2%, ahead of Sydney at 26.5% and Perth at 24.2%.
Fewer sellers are listing, with new capital city listings down 9.2% on a year ago. Even so, total stock is 23.1% higher, because homes are sitting longer. A capital city home now takes a median 39 days to sell, compared with 23 days a year ago. Also, 97% of capital city suburbs lost value over the three months to September. That breadth matters more than any single monthly figure.
Australian house prices by capital city: what to watch into 2027
First, the RBA has two more meetings this year, on 2 to 3 November and 7 to 8 December. Its statement says it will keep “increasing the cash rate target further if needed”. After the September decision, ANZ was the only major bank pricing in another rise in November. CommBank, by contrast, expects cuts in August and November 2027. The full view on that is in the interest rate forecast for 2027.

Second, watch whether the Perth, Adelaide and Brisbane falls stick. PropTrack’s three-month pace already runs at an annualised 8.6% decline in Adelaide, 7.9% in Brisbane and 7.4% in Perth. If that holds, their annual gains will shrink fast in early 2027. Third, the ABS releases its September quarter figures on 1 December 2026. That will be the first official read covering the full spring slowdown. Finally, renters are a separate story, and vacancy trends are in the rental vacancy rates update.
What’s still missing / not confirmed
The sources don’t agree on size. Cotality has Sydney down 7.0% over the year, while PropTrack has it down 5.0%. Cotality shows Perth up 10.1%, but PropTrack shows 6.7%. Each index tracks Australian house prices by capital city with a different method, so compare a city against itself within one index, not across two. Also, no lender or the RBA has published a house price forecast by capital that could be verified. The November rate decision is still open, and bank forecasts for 2027 cuts are forecasts, not commitments.
Editorial read: this is a rate-driven correction, not a crash, and it’s now national. The strong annual numbers in Perth, Adelaide and Brisbane are mostly last year’s growth. They don’t tell you what happens next. Sydney and Melbourne are further into the fall, so their next twelve months may look less ugly than their last twelve. A real turn is only likely once the RBA stops hiking, and that is not clear until early 2027.
Buying in 2026? Then check what the APRA serviceability buffer does to your borrowing limit before you bid on anything.
This article is general information based on Cotality, PropTrack, Australian Bureau of Statistics and Reserve Bank of Australia data available at publication. It isn’t financial advice. Index results get revised and interest rates can change, so check the latest figures and speak with a licensed adviser before you buy or sell.