Rental vacancy rates Australia-wide have finally stopped falling, but that doesn’t mean renters are off the hook. SQM Research’s August count put the national rate at 1.3%, the same as July. Yet under that flat number, the capitals are moving in opposite directions. Sydney and Canberra are loosening, while Darwin, Perth and Adelaide stay locked tight. So here is the late-2026 scoreboard for every capital, what’s behind it, and what to watch next.
Written by Daniel Whitfield, founder of Australia Develops. An accountant by background who has bought land and built a home himself, he researches property development and planning across Australia using council reports, planning records and government data.
Rental vacancy rates Australia: the capital city scoreboard
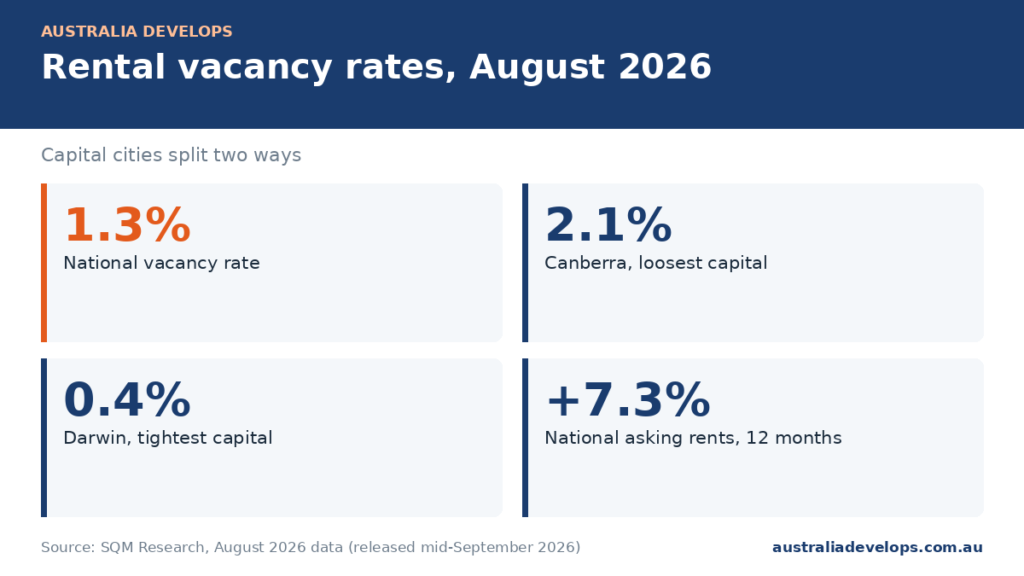
SQM Research tracks online rental listings every month. Its August 2026 figures came out in mid-September. They showed 41,039 vacant rentals nationally, which is 8.7% more than a year earlier. Even so, the rate held at 1.3%. Here’s how each capital looked, with SQM’s asking rent and the change over 12 months.
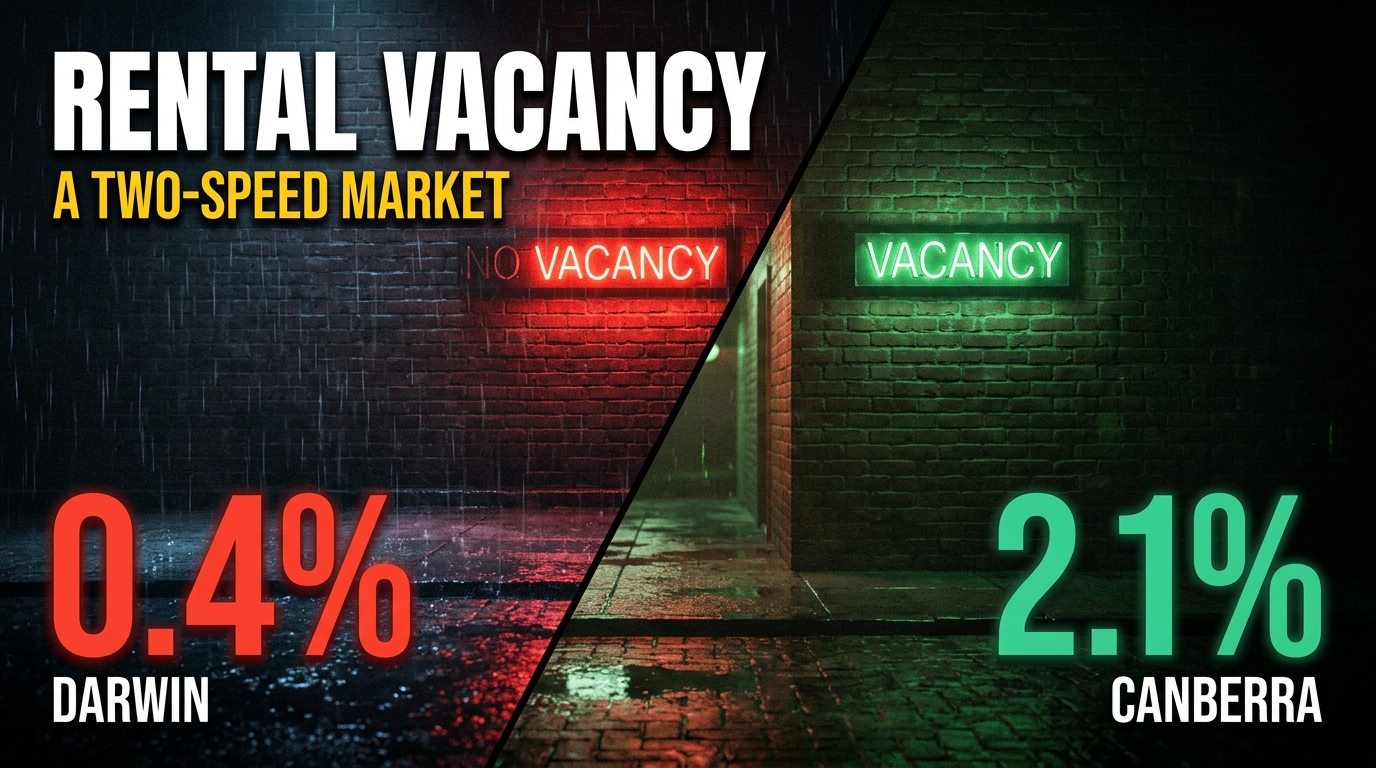
- Canberra: 2.1% vacancy, $687.88 a week, up 3.3%.
- Melbourne: 1.8% vacancy, $695.18 a week, up 6.1%.
- Sydney: 1.7% vacancy, $909.53 a week, up 5.4%.
- Brisbane: 0.9% vacancy, $756.15 a week, up 7.7%.
- Perth: 0.6% vacancy, $801.73 a week, up 7.1%.
- Adelaide: 0.6% vacancy, $644.04 a week, up 3.4%.
- Hobart: 0.6% vacancy, $607.37 a week, up 10.4%.
- Darwin: 0.4% vacancy, $720.65 a week, up 8.7%.
Nationally, SQM’s combined asking rent sat at $701.53 a week. That’s 7.3% higher than a year ago, but it didn’t move at all over the 30 days to 4 September. As SQM’s Louis Christopher put it, “The annual rent figure of 7.3% is history.”
Median weekly rents: why every source gives a different number
To read rental vacancy rates Australia-wide properly, you first need to know the source. If you compare rent reports, you’ll see four different answers. That’s because each one measures something else. SQM averages asking rents on current listings. Domain uses median asking rents for the quarter. Cotality models rents across the whole rental stock. Then the ABS tracks what sitting tenants actually pay, so it moves slowly.
- Domain, June quarter 2026: combined capital house rents of $700 a week and unit rents of $680. Sydney houses hit $850, which Domain called the largest quarterly increase since 2022. Darwin units jumped 18.2% over the year to $650.
- Cotality, September 2026: national rents rose 5.5% over the year, the slowest pace since January. Monthly growth eased to 0.3%. Its own vacancy measure rose to 2%, up from a record low of 1.5% in February.
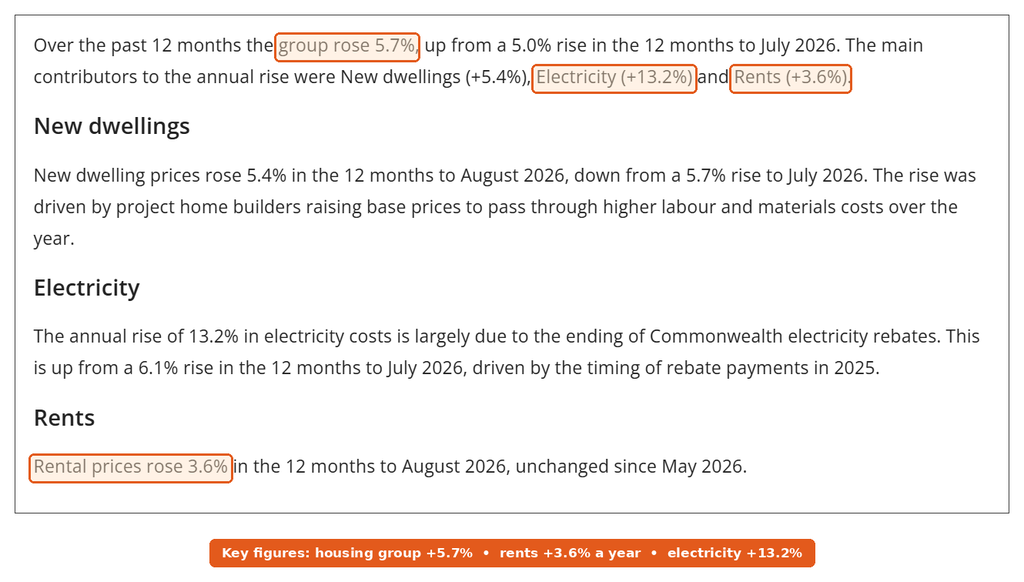
- ABS CPI, August 2026: according to the latest ABS inflation figures, rents rose 3.6% over 12 months, unchanged since May.
So the sources disagree on the level, but they agree on the direction. Rent growth is still positive, yet it’s slowing. Asking rents are up 5% to 7%, while the CPI shows 3.6%. That gap tells you landlords still price new leases well above what existing tenants pay.
Sydney and Canberra lead the easing in Australia’s rental vacancy rates
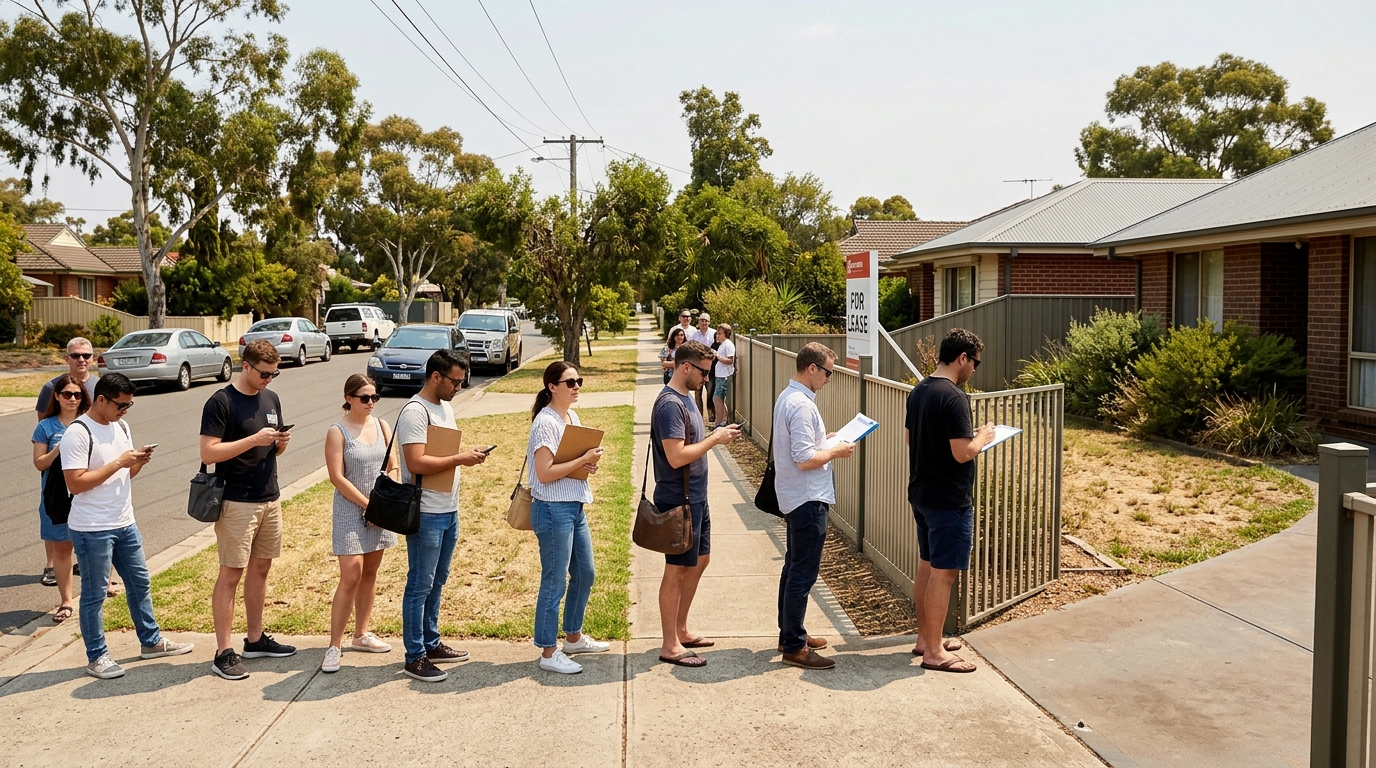
SQM counted 26% more vacant rentals in Sydney than a year earlier, and 29% more in Canberra. Sydney asking rents also fell 0.6% in a month, while Canberra’s dropped 1.6%. Christopher called Sydney “the clearest case of a capital city rental market that has turned”. Cotality’s August numbers point the same way, with Sydney vacancy at 2.2%.
But turned doesn’t mean cheap. Sydney is still the most expensive capital on every measure, at around $910 a week on SQM’s average. If you want the suburb detail and yields, our Sydney rental market breakdown covers that. Melbourne, at 1.8%, is also comfortably looser than the smaller capitals, and it had the same number of vacancies as a year ago.
The tightest capitals: Darwin, Perth, Adelaide and Hobart
At the other end, Darwin had just 94 vacant rentals in August, according to SQM. That’s 30% fewer than a year ago. Perth vacancies fell 14% and Adelaide’s fell 19%. Brisbane, at 0.9%, also had 10% fewer empty rentals than in August 2025. For tenants in these cities, a 0.6% vacancy rate means roughly one empty home for every 170 rentals.
Hobart is the odd one. Its vacancy rate is tight, yet its rents remain the lowest of any capital. Still, SQM shows Hobart asking rents up 10.4% over the year, which is the fastest growth of any capital. Adelaide, by contrast, has slowed to 3.4% growth even with very few vacancies. That suggests tenants there have simply hit their budget limit.
What’s driving rental vacancy rates Australia-wide: migration and construction
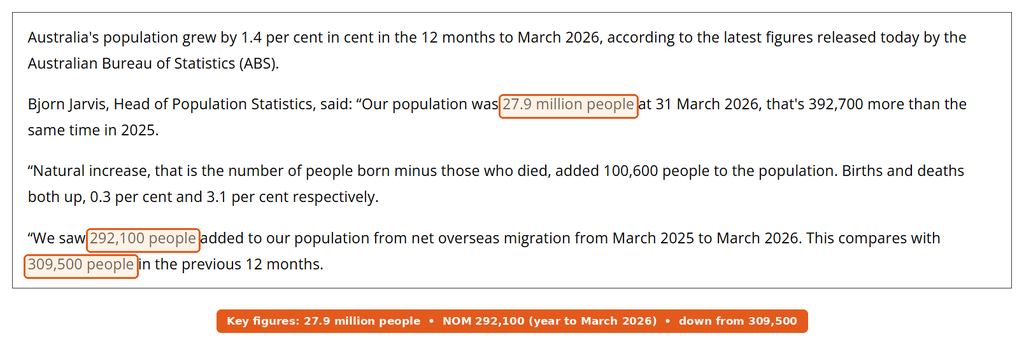
Demand is still growing, though more slowly. The ABS says net overseas migration added 292,100 people in the year to March 2026, down from 309,500 the year before. Population grew 1.4% to 27.9 million. Western Australia grew fastest at 2.1%, which helps explain why Perth stays so tight. Tasmania grew slowest, at 0.6%.
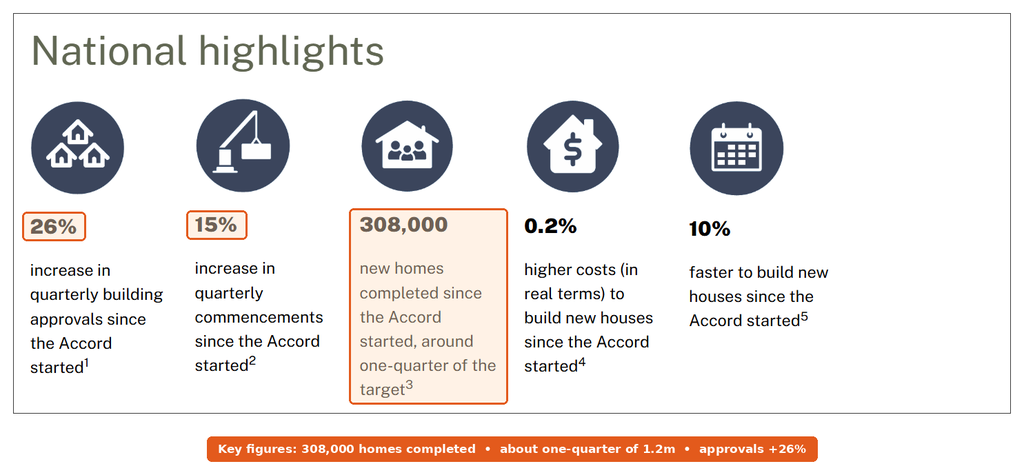
Supply is the other side. The National Housing Supply and Affordability Council says builders have finished 308,000 new homes since the Housing Accord started. That’s around a quarter of the 1.2 million target. It now expects Australia to reach the target in the December quarter of 2030. The council also notes that house construction costs are 51% above pre-COVID levels. On top of that, it warns that recent interest rate rises could see some building deferred.
The investor angle: yields, rates and negative gearing
Rents have risen faster than prices this year, so yields have improved. Cotality put the national gross rental yield at 3.79% in August, the highest since September 2019. In its June quarter review, Darwin led at 6.1% while Sydney sat at 3.3%. Cotality also found the typical household now spends about one-third of gross income on rent, compared with around 27% five years ago.
Policy is also shaping asking rents. Domain’s Nicola Powell said the June quarter jump “was too sudden and concentrated to be explained by seasonal factors alone”. She linked it instead to landlords responding to the proposed removal of negative gearing for established homes from 1 July 2027. Our negative gearing and CGT explainer explains how that change would work.

Rental vacancy rates Australia-wide: what renters and investors should watch
- SQM’s monthly count. Christopher expects the national rate to drift towards 1.4% to 1.5% by December. He also sees Sydney reaching 1.9% or higher.
- Monthly rent changes, not annual ones. Annual figures lag. So watch the 30-day moves in Sydney and Canberra for the first real falls.
- Migration data. The next ABS population release will show whether net overseas migration keeps easing.
- Interest rates. Higher rates squeeze both investors and builders. Our interest rate forecast for 2027 sets out the scenarios.
- The ABS CPI rent line. If it stays at 3.6% while asking rents slow, the two measures will start to converge.
What’s still missing / not confirmed
Domain’s September quarter rent report wasn’t out at the time of writing, so its capital medians here are from June. Also, SQM and Cotality use different methods. SQM has the national rate at 1.3%, while Cotality has it at 2%, so don’t mix the two in one comparison. The negative gearing change is still described as proposed, and its final design could shift. Finally, nobody has published a reliable forecast of how many investors will sell before July 2027, which is the biggest unknown for rental supply.
My take: the national 1.3% is hiding a two-speed market, and the speeds will keep pulling apart. Sydney and Canberra renters now have some room to negotiate on renewals, because listings sit longer and asking rents are slipping. But Perth, Adelaide, Darwin and Brisbane still have well under 1% vacancy. So I wouldn’t expect relief there before mid-2027 unless migration drops sharply.
For investors, I’d treat this as a yield story, not a growth story. The best yields sit in the tightest markets, but that’s also where the negative gearing change and rate rises will bite hardest on new purchases. So run the numbers on rent alone before you buy, and assume no capital growth for the first two years.
Thinking about adding a rental to your own block instead? Then check the granny flat rules in your state first.
This article is general information based on SQM Research, Cotality, Domain, ABS and National Housing Supply and Affordability Council data available at publication. It isn’t financial advice. Rents, vacancy rates and tax settings can change, so check current figures with each provider before you sign a lease or buy.