Australia added 392,700 people in the year to March 2026. But that growth didn’t land evenly. Australia population growth by state now splits into three groups. Western Australia leads on pace, Victoria and Queensland lead on raw numbers, and New South Wales keeps losing residents to other states. So here is what the latest official data shows. You’ll also see where people are going and what it means for housing demand in the growth corridors.
This article was produced and reviewed by the Australia Develops editorial team. See our Editorial Policy for sourcing standards and methodology.
The national picture as of September 2026
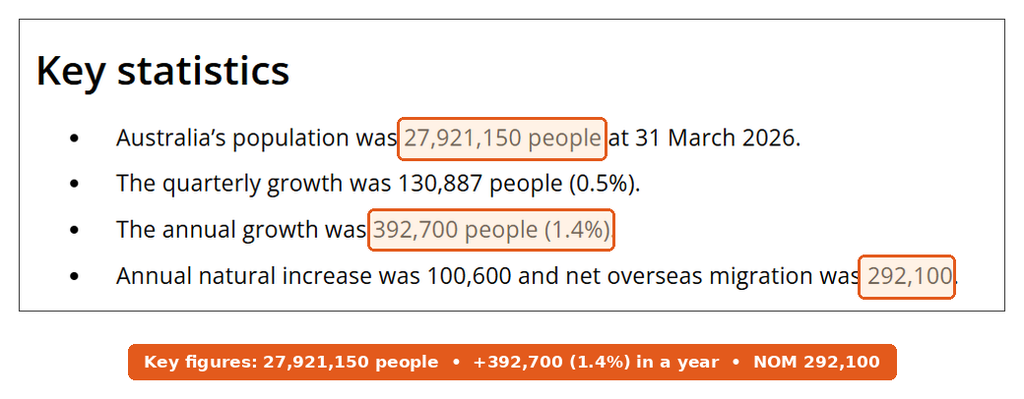
The Australian Bureau of Statistics (ABS) put out its latest national, state and territory population release on 17 September 2026. It covers the year to 31 March 2026. At that date, Australia had 27,921,150 people. The population grew by 130,887 in the March quarter alone, and by 392,700 (1.4%) over the year.
Two things drove that growth. First, natural increase (births minus deaths) added 100,600 people. Second, net overseas migration added 292,100. So migration still does about three quarters of the work. Still, the pace is easing. The ABS puts annual growth at 1.43%, down from 1.53% a year earlier. Overseas arrivals fell 4.0% to 557,500, while departures fell 2.2% to 265,400.
Australia population growth by state: the 2026 table
Every state and territory grew in the year to March 2026, so none went backwards. But the gap between the fastest and slowest is wide. Here is how each one moved, using the ABS figures.
- Western Australia: 3,096,200 people, up 64,200 (2.1%). That’s the fastest rate in the country.
- Victoria: 7,154,200 people, up 109,500 (1.6%). It added the most people of any state.
- Queensland: 5,739,500 people, up 90,100 (1.6%).
- Northern Territory: 268,900 people, up 4,000 (1.5%).
- ACT: 489,700 people, up 6,200 (1.3%).
- New South Wales: 8,670,100 people, up 97,000 (1.1%).
- South Australia: 1,916,800 people, up 18,400 (1.0%).
- Tasmania: 580,700 people, up 3,400 (0.6%). That’s the slowest rate.
The rate and the headcount tell different stories. WA grows fastest because it starts from a smaller base. Yet Victoria still adds the most bodies, and those bodies need homes. For a builder or land developer, the raw number usually matters more than the percentage.
Interstate migration: who wins and who loses
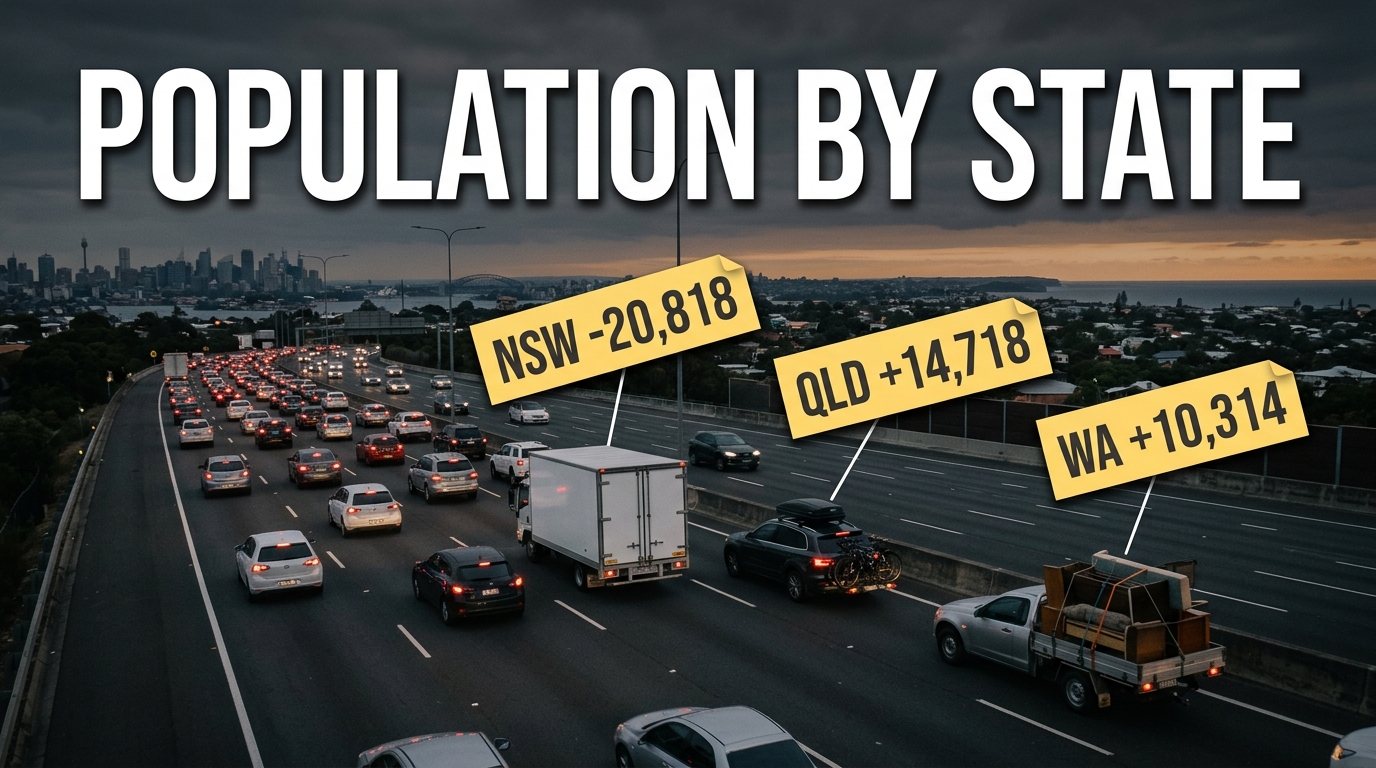
Overseas migration props up every state. Interstate moves, by contrast, pick clear winners and losers. In the year to March 2026, the ABS counted these net interstate flows:
- Queensland: +14,718. It gained 98,121 arrivals against 83,403 departures.
- Western Australia: +10,314.
- Victoria: +82, which is basically flat.
- Tasmania: -98.
- South Australia: -1,208.
- ACT: -1,401.
- Northern Territory: -1,589.
- New South Wales: -20,818. Around 106,700 people left, while only 85,900 moved in.
NSW is the outlier. It took the most overseas migrants of any state (84,573 net). But it lost a fifth of that number to other states. Housing costs are the likely reason. Queensland and WA are the main beneficiaries, and both still offer land within reach of a capital city.
Australia population growth by state capital and suburb
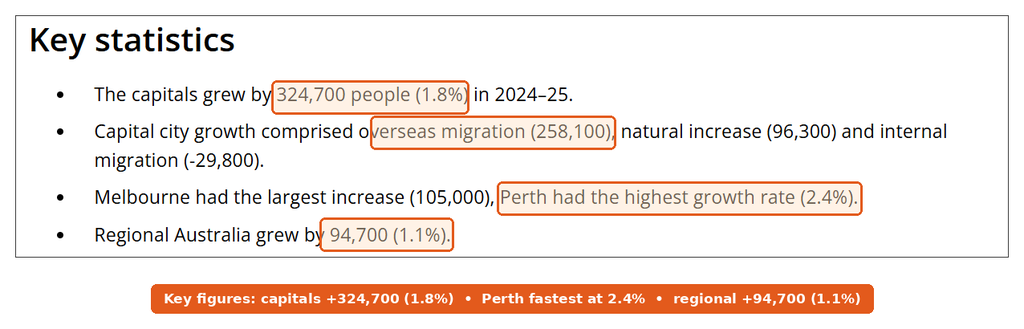
For suburb-level detail, the ABS regional population release is the best guide. It came out on 31 March 2026 and covers 2024-25, so it runs a year behind. Still, it shows where new households actually landed. The capitals grew by 324,700 people (1.8%), while regional Australia grew by 94,700 (1.1%).
Perth had the highest growth rate at 2.4%. Then came Brisbane (2.1%) and Melbourne (2.0%). Melbourne added the most people, at 105,000. Sydney followed with 75,200 (1.4%), then Adelaide with 18,600 (1.3%). Hobart barely moved, adding just 540 people.
Below the capital level, the biggest gains all sit on the urban fringe. In Victoria, Rockbank – Mount Cottrell added about 4,600 people and Fraser Rise – Plumpton about 4,100. In NSW, Box Hill – Nelson added 3,900 and Marsden Park – Shanes Park 3,200. In Queensland, Ripley led with 3,100. In South Australia, Munno Para West – Angle Vale added 2,400. In WA, Alkimos – Eglinton added 2,500.
What Australia population growth by state means for housing demand
In other words, the suburb list above reads like a map of greenfield land supply. That’s no accident. New households go where builders can deliver homes quickly and at a price people can borrow. So the corridors with titled lots and open schools absorb the growth first.
In south-east Queensland, Ripley Valley was the state’s fastest-growing area at 15%. Interstate arrivals plus overseas migration keep Logan and Ipswich corridors busy. In Perth, the northern corridor is the standout. Alkimos – Eglinton grew 13%, and Ellenbrook to the north-east competes for similar buyers. In Melbourne, the west dominates the ABS list. But the south-east still matters, and Clyde North is another growth front worth watching.

NSW is harder to read. It gains people from overseas but loses them to other states. So demand concentrates in Sydney’s land release areas, such as Box Hill and Marsden Park in the north-west. Adelaide’s northern fringe tells a similar story at a smaller scale, with Angle Vale and Virginia – Waterloo Corner leading SA.
The official projections for the next decade
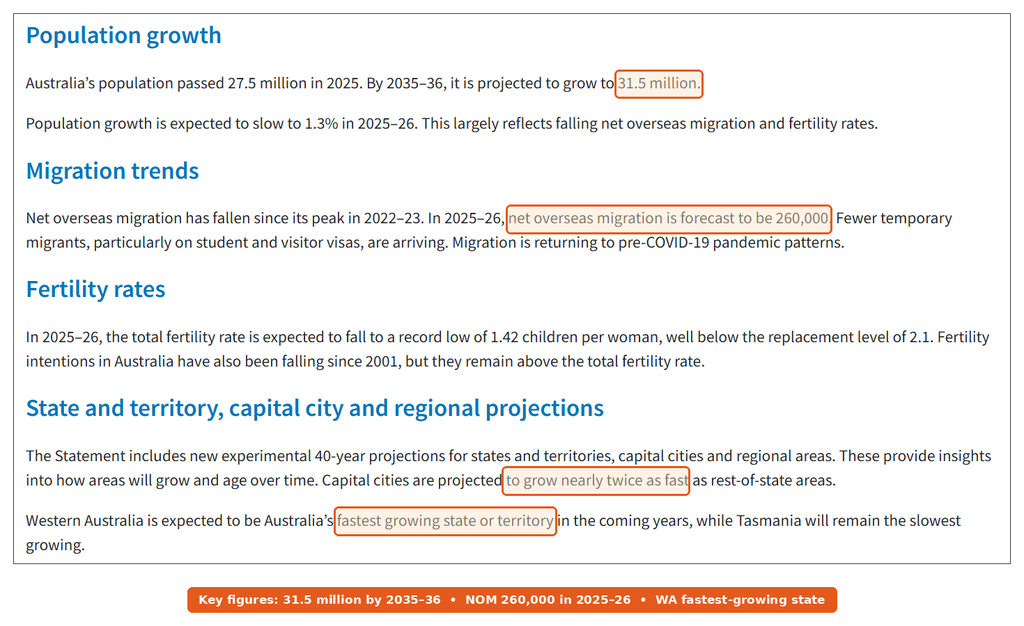
The Centre for Population published the 2025 Population Statement in January 2026. It projects Australia’s population to reach 31.5 million by 2035-36. It also expects growth to slow to 1.3% in 2025-26, then 1.2% from 2026-27 onwards. Net overseas migration should fall to 260,000 in 2025-26 and then decline further.
On Australia population growth by state, the statement is blunt. It says WA should stay the fastest-growing state or territory in the coming years, while Tasmania stays the slowest. It also expects capital cities to grow nearly twice as fast as the rest of each state. That points demand back at the metro fringe rather than regional towns.
Projections are not forecasts of what will happen, only of what current assumptions imply. Still, they are what state governments use when they size land releases, schools and water infrastructure, so the headline numbers are worth having in one place.
What’s still missing / not confirmed
First, the forecasts and the data don’t line up yet. Treasury expects net overseas migration of 260,000 for 2025-26. But the ABS counted 292,100 for the year to March 2026. Those periods aren’t identical, so it isn’t a like-for-like miss. Even so, the June quarter figures, due on 17 December 2026, will show whether migration came in above forecast.

Second, policy can move the numbers quickly. The 2026 National Planning Level allows 295,000 new international student commencements, up from 270,000 in 2025. A future government could tighten or loosen that. Also, the Population Statement gives state rankings on its web page. But its detailed state tables sit in downloadable data. Finally, the suburb data covers 2024-25, so it can’t show any shift in buyer behaviour since mid-2025.
The data on Australia population growth by state supports one clear call. WA and south-east Queensland have the strongest demand base right now, because they win on both overseas and interstate migration. Victoria adds the most people, but it also has the deepest land supply, so price pressure there stays more muted. NSW keeps importing migrants and exporting residents. So Sydney’s fringe estates should stay busy, while the state as a whole grows slower than its neighbours.
If you’re tracking where demand turns into prices, see the Australia Develops house prices by capital city breakdown next.
This article is general information based on ABS, Centre for Population and Australian Government releases available at publication. It isn’t financial advice. Population estimates are revised each quarter and forecasts can change, so check the latest ABS figures before you make a property decision.