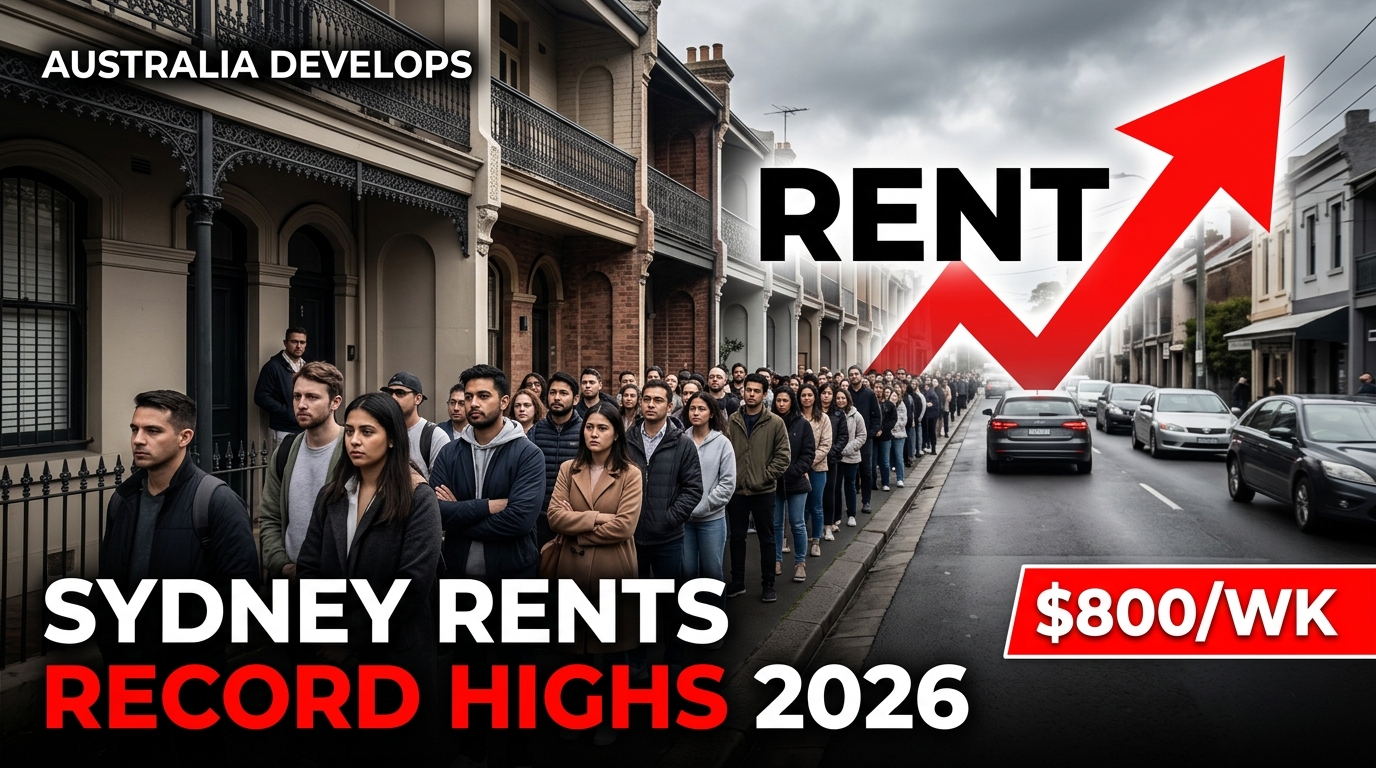
The Sydney rental market in 2026 remains one of the most structurally constrained in the developed world. With a vacancy rate sitting at just 1.6% as of July 2026 — less than half the 3% threshold economists associate with a balanced market — tenants across Greater Sydney are competing fiercely for a pool of available rental stock that has failed to keep pace with the city’s population growth for the better part of four years.
Rents have risen approximately 5.8% over the year to May 2026, with houses leading at 6.3% and units at 5.1%.
This pushed median house rents to a record $800 per week in the March 2026 quarter, according to Domain’s March 2026 Rental Report.
This guide covers the data, the structural drivers, and the suburb-level picture for investors, landlords, and tenants navigating Sydney’s rental market this year.
Written by Daniel Whitfield, founder of Australia Develops, who has personally bought, subdivided, and built property across Australia. Updated July 2026.
Furthermore, Commercial Real Estate Yields are central to Sydney rental investment decisions. Australia Develops’ NSW commercial property guide provides wider market context.
Additionally, Institutional Investment Infrastructure supports rental demand near major employment precincts. Foreign Direct Investment (FDI) Australia activity also influences build-to-rent funding and supply.
Sydney Rental Market Snapshot
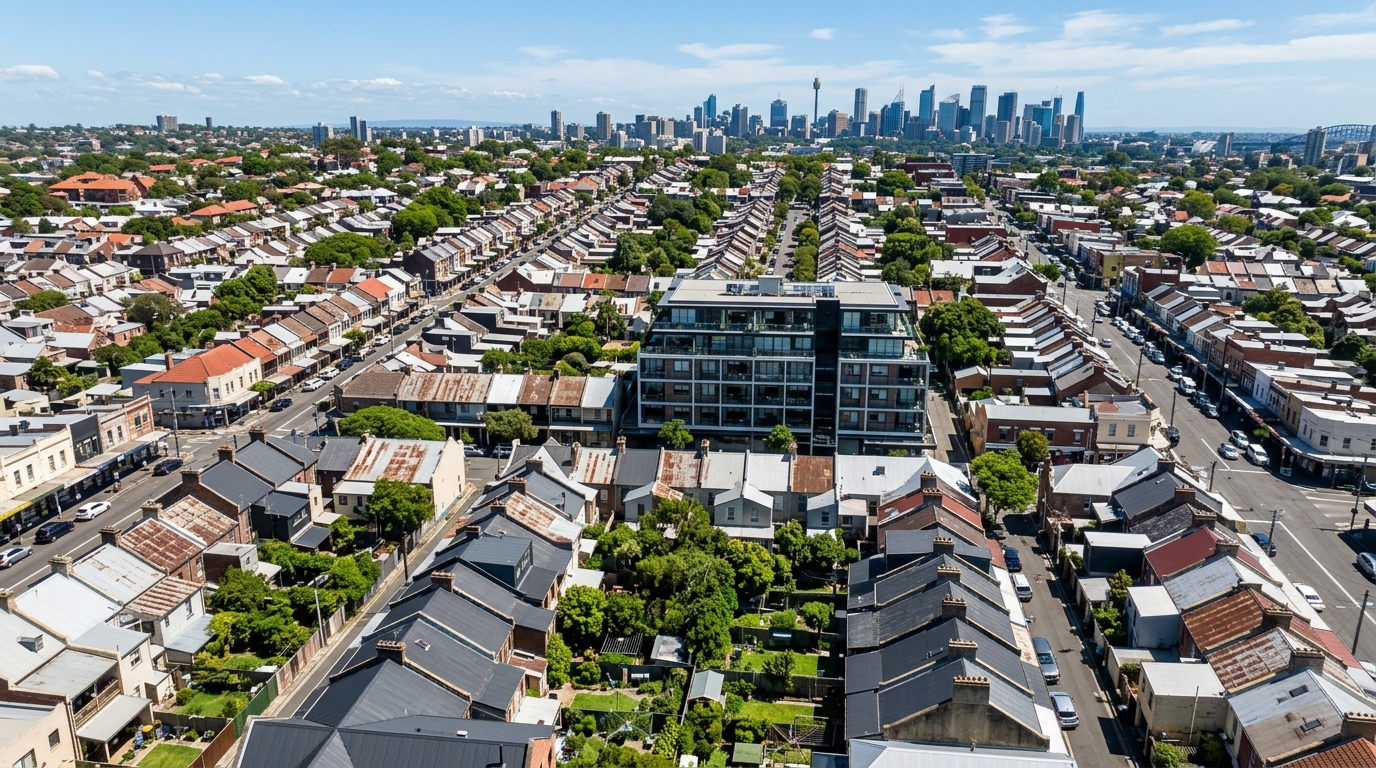
Sydney Rental Vacancy Rate 2026: Reading the Numbers
Indeed, Sydney’s vacancy rate of 1.6% as of July 2026, as measured by SQM Research, represents approximately 11,957 dwellings listed as vacant across the metropolitan area.
While this figure has crept slightly above the 1.5% recorded in the prior month — a marginal easing reflecting the typical mid-year seasonal pattern of lease renewals and new stock additions — it remains dramatically below the 3% threshold that housing economists associate with a market in equilibrium between landlords and tenants.
At the national level, the picture is, if anything, tighter: SQM Research recorded a national vacancy rate of just 1.0% in April 2026, confirming that Sydney’s structural tightness reflects a broader Australian rental supply deficit rather than a localised phenomenon.
Vacancy by Inner, Middle and Outer Ring
Indeed, vacancy conditions vary sharply by geography and benchmark across the Sydney rental market.
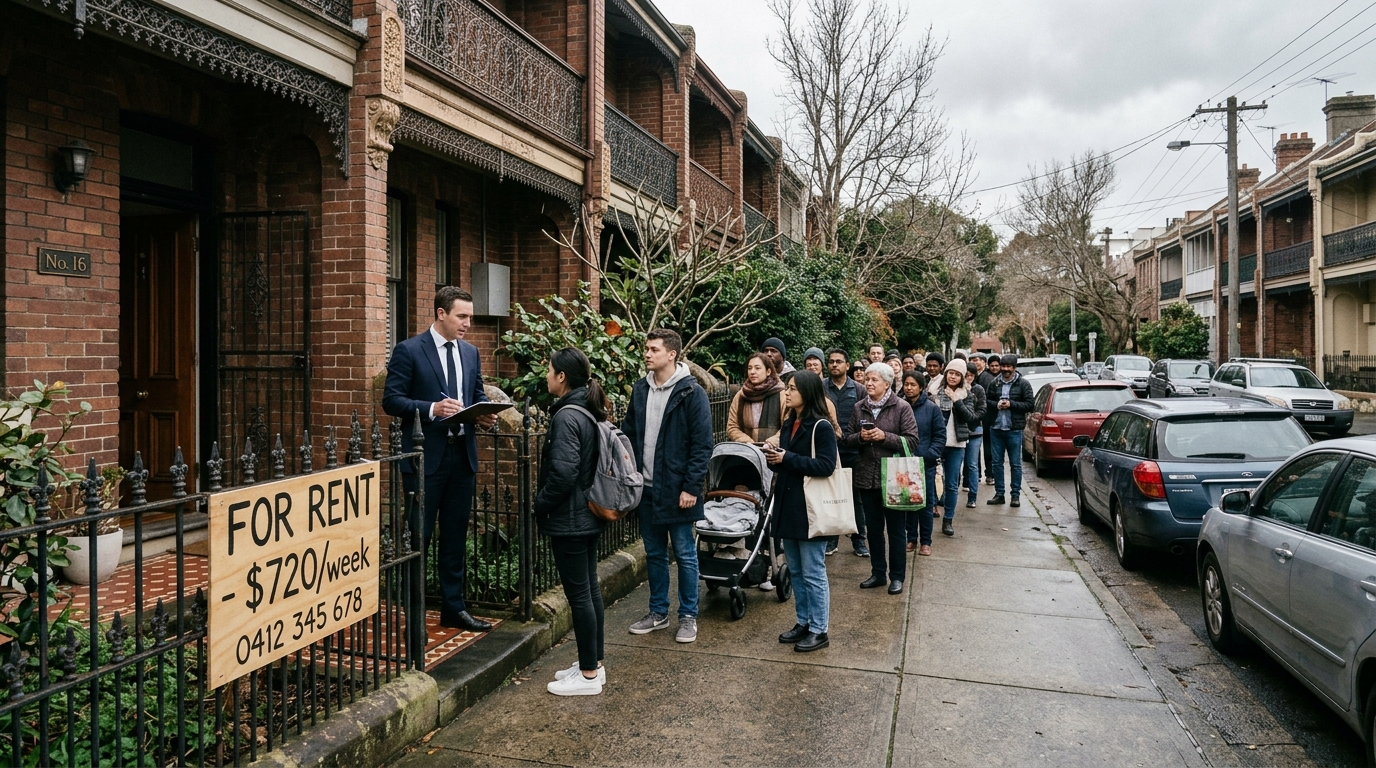
Indeed, this competitive rental environment is visible firsthand at inspections across the city.
Sydney Rent Growth 2026: Houses Versus Units
Furthermore, Sydney rents grew 5.8% over the year to May 2026, with houses outperforming units at 6.3% and 5.1% respectively.
The median weekly rent for a Sydney house reached $800 per week in the March 2026 quarter — a record, though the pace of quarterly growth has moderated compared to the sharp increases recorded in 2023 and 2024.
The moderation reflects affordability constraints rather than supply improvement: at $800 per week, households earning below the Sydney median income of approximately $2,100 per week gross are being priced out of entire rental segments, compressing demand into the unit market and regional areas.
Units tracked at approximately $680 per week for a two-bedroom dwelling in early 2026 according to Domain, with inner-city and harbour-adjacent locations commanding premiums of $800 to $1,200 per week for comparable stock.
Furthermore, the chart below breaks down this rental growth trend in more detail.
Rental Affordability: The Income Gap
Moreover, the most significant structural shift in Sydney’s rental market over the 2020s has been the deterioration of rental affordability.
Renters in Sydney now spend a record 33.1% of gross household income on rent, up from 26.2% in 2020, according to housing affordability data compiled by Domain and the Australian Housing and Urban Research Institute (AHURI).
The conventional definition of rental stress — spending more than 30% of gross income on rent — now applies to the majority of low-to-moderate income renting households in Sydney, a dramatic shift from the position a decade ago when rental stress was concentrated among the lowest income quintile.
How Renters Are Responding
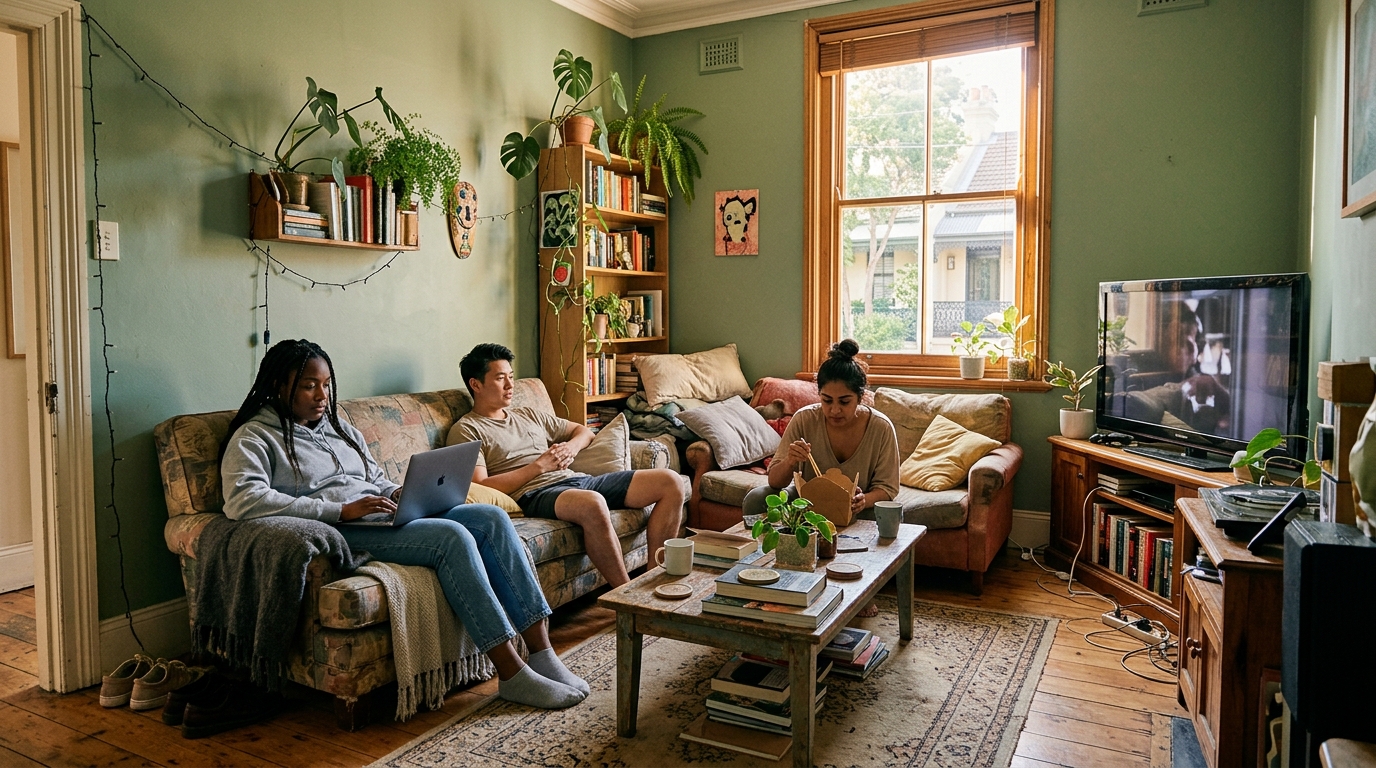
Consequently, the affordability squeeze has manifested in a range of behavioural responses that are reshaping the geography of the Sydney rental market.
Increasing numbers of professional households are relocating to middle and outer ring suburbs to access sub-$600 per week rents, absorbing rental stock in areas that previously served lower-income households.
Share housing arrangements are becoming more common across all age groups, with the average share house size in Sydney increasing.
Additionally, tenants are extending lease terms and committing to longer fixed agreements at market rent to avoid re-entering the rental market.
Indeed, the proportion of Sydney tenants staying in their properties for more than two years has increased materially since 2022, as the cost of moving — both financial and in terms of search effort — has risen sharply.
Furthermore, the share of income spent on rent has climbed steadily over the past six years.
Additionally, this pressure has visibly changed how renters live day to day.
Moreover, the data below outlines what this shift means for the investment landscape.
Where Are Sydney Rental Yields Highest in 2026?
In particular, for property investors assessing the Sydney rental market in 2026, gross yields remain compressed relative to the rest of Australia. This reflects the city’s high land values and the structural gap between rent levels and purchase prices.
Sydney houses produce a gross yield of approximately 3.3% at the metropolitan level, the lowest of any capital city, according to data from CoreLogic.
Units perform marginally better, tracking around 4.0% to 4.5% gross in inner and middle ring locations where purchase prices have not kept pace with rent growth.
However, the yield picture varies significantly by geography within Sydney.
Highest-Yielding Sydney Submarkets
Build-to-Rent: New Supply in the Pipeline
Additionally, build-to-rent (BTR) development has emerged as one of the most significant structural changes to the Sydney rental supply pipeline over 2025 and 2026.
Unlike the traditional strata development model — where individual investors purchase apartments that are subsequently offered for rent — BTR development involves institutional investors constructing entire residential buildings for long-term rental, with professional management and amenities orientated toward the renter experience.
The NSW Government has supported BTR with land tax concessions and planning pathway improvements. Several large BTR projects are now in construction or recently completed in Sydney’s inner ring and Parramatta corridor.
BTR Supply and Scale
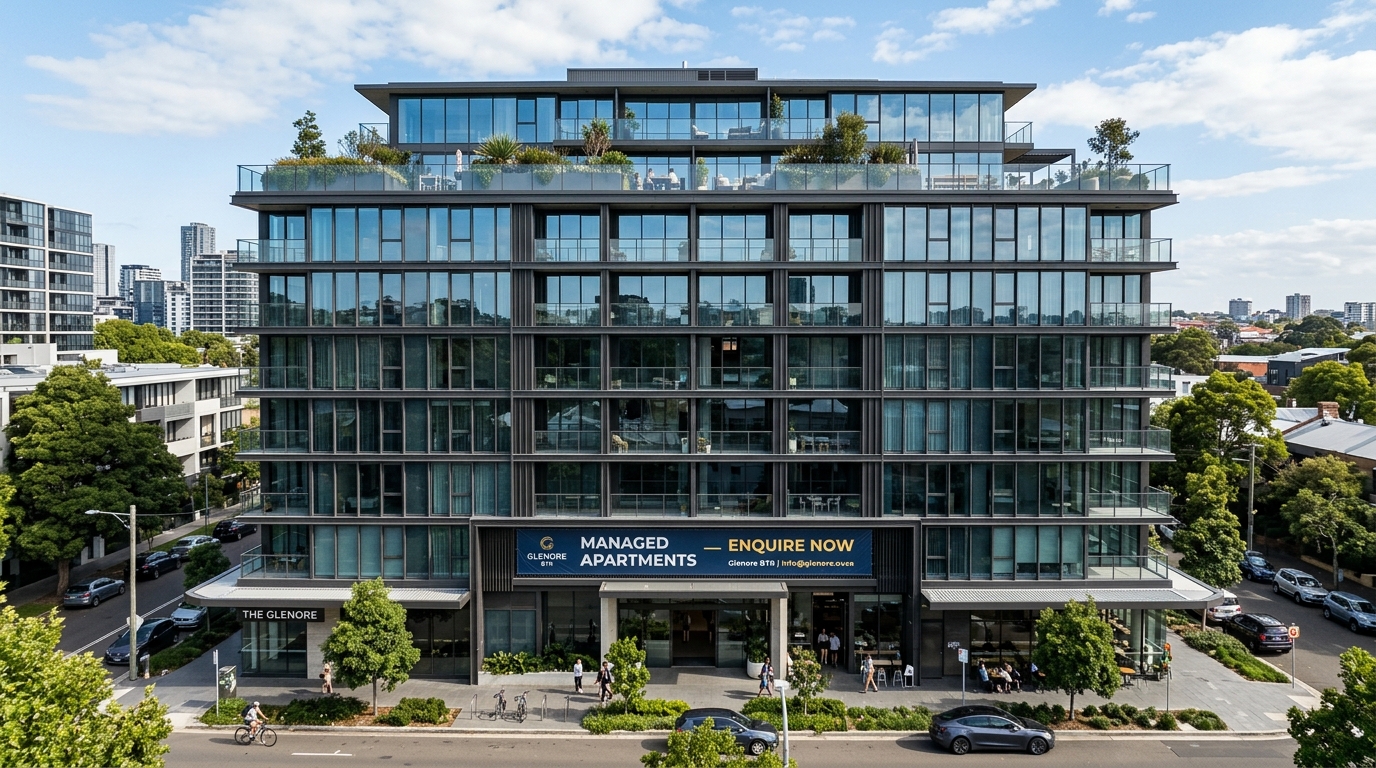
Overall, the following figures summarise where build-to-rent supply currently stands.
However, build-to-rent supply remains a modest share of Sydney’s overall rental stock despite rapid growth.
Suburb Spotlight: Tightest Rental Markets in Greater Sydney 2026
However, while the metropolitan average vacancy rate of 1.6% is historically low, certain corridors within Greater Sydney are experiencing conditions substantially tighter than this figure suggests.
The Hills District — encompassing Castle Hill, Baulkham Hills, Kellyville, and Rouse Hill — has recorded vacancy rates consistently below 0.8% through the first half of 2026.
This is driven by strong demand from families relocating from inner Sydney and a relatively low supply of rental stock given the owner-occupier character of the area. The North-West Metro corridor has added some new strata rental stock.
However, absorption has been rapid given the employment growth in the Macquarie Park and Norwest precincts.
In Sydney’s south-west, Campbelltown, Camden, and Liverpool are recording vacancy rates of 0.9% to 1.1%, with demand driven by the large and growing population base in the Macarthur and South-West growth corridors.
The share of households renting rather than owning is well above the Sydney metropolitan average. In Western Sydney, the Parramatta LGA — which encompasses the city’s fastest-growing employment precinct outside the CBD — recorded a vacancy rate of 1.1% in June 2026 according to LandSales vacancy data, with demand concentrated in the $550 to $700 per week unit bracket from healthcare and education workers employed in the Westmead and Parramatta Square precincts.
For more on Parramatta’s broader development context, see Australia Develops’ coverage of Parramatta CBD Development 2026.
What Tenants and Landlords Should Expect for the Rest of 2026
For tenants, the outlook for the remainder of 2026 offers little relief. Vacancy rates are unlikely to improve materially before the end of the year given the dwelling completion pipeline and population growth trajectory.
The most practical strategies for tenants in a tight market include engaging directly with property managers before listings go public, providing comprehensive and well-presented rental applications, and considering middle-ring and outer-ring locations where the combination of lower competition and improving transport connectivity — through the North-West Metro, South-West Metro extensions, and Parramatta Light Rail — is reducing the penalty of commuting from more affordable locations.
Additionally, build-to-rent developments in inner Sydney are offering more transparent application processes and longer lease terms. This may suit tenants who prioritise stability over location.
What This Means for Landlords
For landlords, the 2026 market continues to favour well-maintained properties presented at market rent. Properties that have fallen behind market rent — either through extended tenancies where annual increases have not kept pace with market growth, or through periods of vacancy — are achieving rapid re-leasing at substantially higher rents when they come to market.
Landlords considering capital expenditure on rental properties should be aware that the strong tenant demand is broad-based enough to support yield improvements on well-located properties across most price brackets.
The structural tightness in the market is also unlikely to normalise quickly enough to erode the demand advantage landlords currently hold.
Some landlords are responding by adding a granny flat or pursuing dual occupancy subdivision to capture additional rental income from the same block.
In particular, the comparison below sets out the key considerations for each side of the market.
Overall, both tenants and landlords face a distinct set of strategic considerations for the rest of 2026.
• Submit comprehensive, well-presented applications
• Consider middle and outer ring suburbs near new transport links
• Look at build-to-rent for transparent processes and longer leases
• Well-maintained properties command rent premiums
• Consider a granny flat or dual occupancy to add rental income
• Structural tightness continues to favour landlords near-term
Key Data at a Glance — Sydney Rental Market 2026
| Metric | Figure (2026) |
|---|---|
| Sydney Vacancy Rate (July 2026) | 1.6% (~11,957 dwellings) |
| National Vacancy Rate (April 2026) | 1.0% (SQM Research) |
| Annual Rent Growth — Houses (to May 2026) | +6.3% |
| Annual Rent Growth — Units (to May 2026) | +5.1% |
| Median Weekly House Rent (Sydney) | $800/week (Q1 2026 record) |
| Median 2BR Unit Rent (Sydney) | ~$680/week |
| Rental Affordability (% of gross income) | 33.1% (up from 26.2% in 2020) |
| Sydney House Gross Yield (metro avg) | ~3.3% |
| Highest Yielding Areas (houses) | Campbelltown, Liverpool, Fairfield (4.2–4.8%) |
| Tightest Vacancy Corridors | Hills District, Campbelltown, South-West (<1.1%) |
| Build-to-Rent National Pipeline | ~20,000–25,000 units (planning + construction) |
Summary — Sydney Rental Market Outlook
The Sydney rental market in 2026 is defined by a structural imbalance between supply and demand that has been building for most of the decade.
A vacancy rate of 1.6% — less than half the balanced-market threshold — is the quantitative expression of a market where population growth, net overseas migration, and constrained dwelling construction have combined to create conditions that are simultaneously challenging for tenants and supportive for landlords.
Rents growing at 5.8% annually are compressing household budgets and reshaping the geography of where different income groups can afford to live in Greater Sydney.
The outer south-west and western growth corridors are absorbing demand displaced from inner Sydney by rent levels that are increasingly unaffordable for median-income earners.
The Investor Outlook
For investors, the Sydney rental market in 2026 presents a complex picture. Gross yields at the metropolitan average of 3.3% remain low by Australian standards, reflecting the city’s high land values.
However, in the outer ring and growth corridor locations — particularly Campbelltown, Liverpool, Parramatta, and the Hills District — yields of 4.0% to 4.8% are achievable on well-located stock, providing income returns that are more competitive with other capital cities.
Additionally, the structural tightness of the market provides strong downside protection on vacancy for landlords, as the volume of qualified rental applicants per available property across most Sydney suburbs remains at historically elevated levels.
As noted in Australia Develops’ coverage of the NSW TOD Rezoning Program, station precincts within the TOD overlay are likely to see increased rental demand as medium-density development delivers new residents to transit-connected locations through the late 2020s.
The supply response that would normalise Sydney’s rental market remains constrained. Build-to-rent is growing but represents a small fraction of the private rental stock.
New dwelling approvals are recovering from post-2022 lows but remain below the rates required to meet the National Housing Accord targets.
Consequently, the structural rental tightness that has characterised Sydney since 2022 is unlikely to meaningfully ease before 2028 at the earliest.
Any near-term improvement in vacancy rates is more likely to reflect further affordability-driven demand destruction — tenants leaving Sydney, doubling up, or reducing space — than genuine supply improvement.
The Sydney rental market in 2026 is, in short, a landlord’s market by necessity rather than by design.
Frequently Asked Questions
What is Sydney’s rental vacancy rate in 2026?
Sydney’s rental vacancy rate was 1.6% as of July 2026, according to SQM Research, well below the 3% threshold associated with a balanced market. Inner Sydney recorded 1.8–2.2%, while middle and outer ring suburbs were consistently below 1.2%.
How much have Sydney rents risen in 2026?
Sydney rents grew 5.8% over the year to May 2026. Houses rose 6.3% to a median $800 per week, while units rose 5.1% to a median $680 per week for a two-bedroom dwelling.
Where are rental yields highest in Sydney in 2026?
The highest gross rental yields are in the outer south-west and western growth corridors. Campbelltown LGA houses yield approximately 4.2–4.8%, compared with just 3.3% for Sydney metro houses overall, the lowest of any Australian capital city.
What share of income do Sydney renters spend on rent?
Sydney renters now spend a record 33.1% of gross household income on rent, up from 26.2% in 2020, according to Domain and AHURI. This exceeds the conventional 30% rental stress threshold.
This article is for general informational purposes only and does not constitute financial, investment, or legal advice. Seek independent professional advice before making property decisions. See our Disclaimer for details.