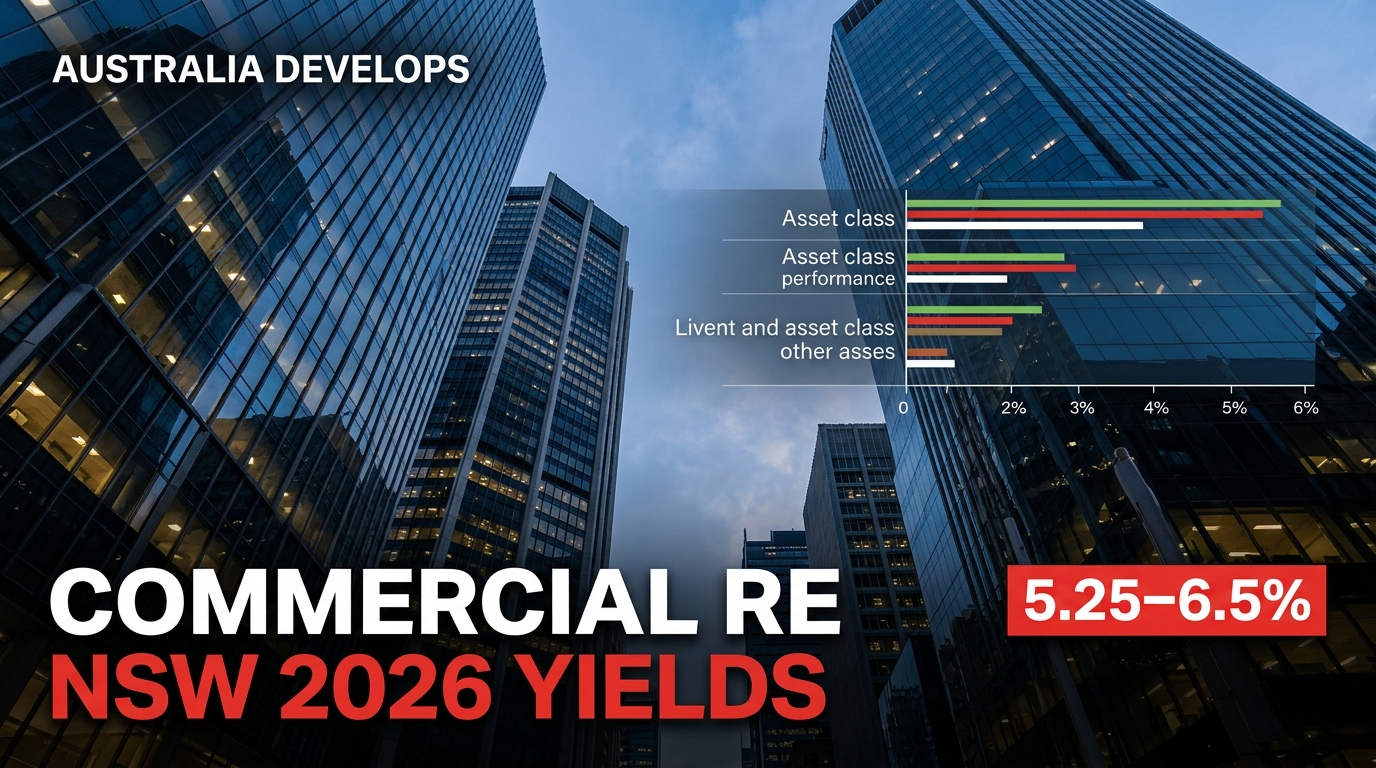
NSW commercial real estate 2026 confirms a market in divergence. Furthermore, the industrial and logistics sector attracts the deepest institutional capital pools in Australia. Structurally low vacancy and a largely pre-committed supply cycle underpin this trend.
The Western Sydney Airport opening this year is a transformative demand catalyst. Indeed, retail is delivering the strongest leasing conditions in years. Neighbourhood and convenience-based centres are leading this recovery.
Office is a more complex story. A clear flight to quality is emerging, with premium CBD space tightening. Meanwhile, secondary grades and fringe markets face elevated vacancy.
This guide covers all three major sectors — office, industrial, and retail. Overall, it draws on verified 2026 data from Property Council of Australia, JLL, Cushman & Wakefield, Colliers, and CBRE.
Written by Daniel Whitfield, founder of Australia Develops, who has personally bought, subdivided, and built property across Australia.
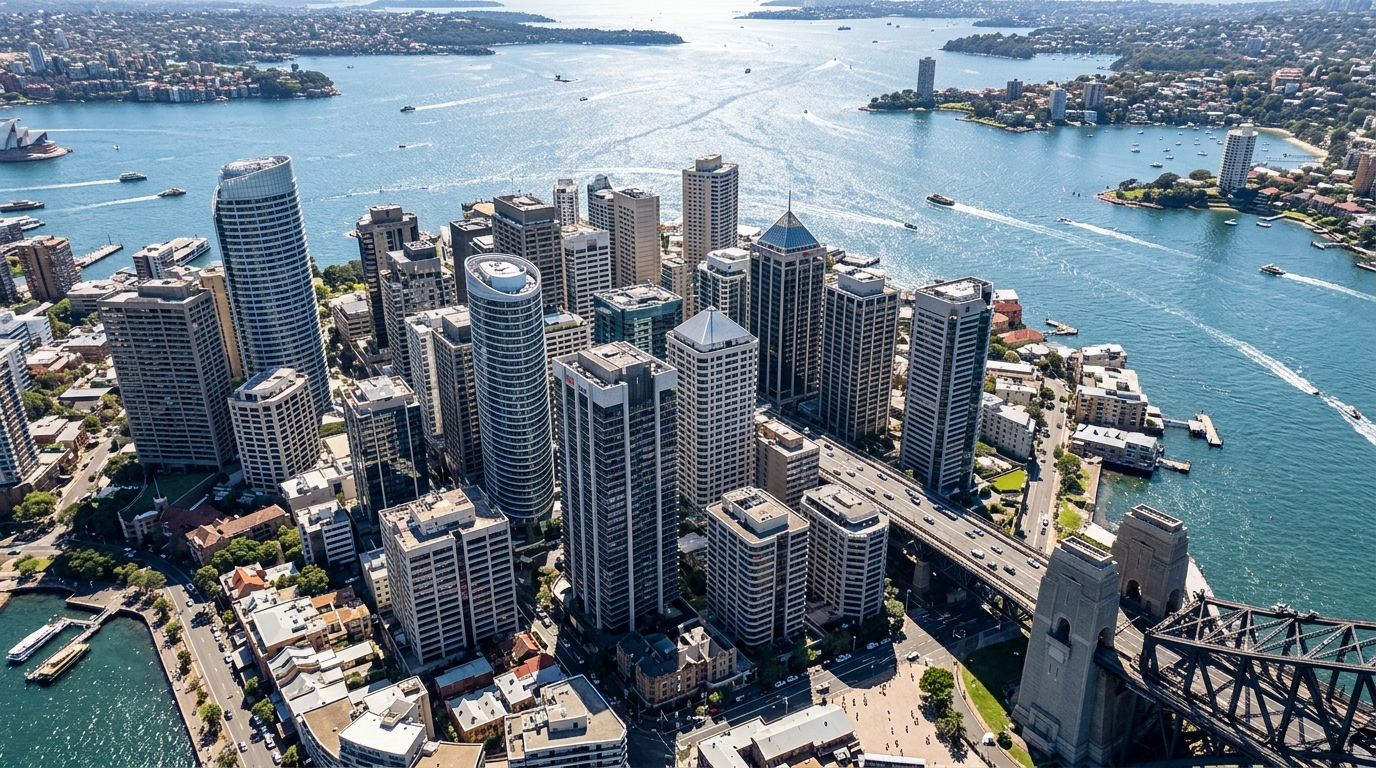
NSW commercial real estate 2026 continues to dominate national transaction activity, capturing 43.1% of all national commercial transactions in 2024–25.
Foreign investment reached an estimated $9.3 billion in 2025, up 12% year-on-year, with North American and Asian capital targeting prime NSW assets — a clear signal of sustained Foreign Direct Investment (FDI) Australia benchmarks within the commercial property sector.
Understanding how each commercial sector is performing in 2026 is critical context for anyone tracking the NSW property and planning landscape — and the outlook across the three major asset classes is diverging significantly in ways that matter for occupiers, developers, and infrastructure planners alike.
For residential context, see Australia Develops’ coverage of the NSW TOD rezoning program and Parramatta CBD development.
NSW Commercial Real Estate 2026 at a Glance
The snapshot below summarises 2026 performance across all three major NSW commercial sectors.
The Office Flight to Quality
The Sydney CBD office market’s headline vacancy figure — 13.8% as at January 2026, the highest level in approximately 30 years — tells only part of the story.
Beneath the aggregate, the market is undergoing a structural bifurcation that is reshaping tenant demand patterns and development economics in ways that will persist for years.
Premium CBD office vacancy tightened from 10.9% to 8.9% over the year to January 2026, while A-Grade vacancy fell from 17.6% to 16.6% over the same quarter.
B-Grade vacancy, by contrast, moved higher from 14.4% to 16.0%, and the all-Sydney market vacancy (including non-CBD precincts) remained flat at 21.5%.
This is the clearest empirical signal of a “flight to quality” trend that has been building since the post-pandemic reassessment of office use.
Why Office Demand Is Bifurcating
The structural driver of this bifurcation is the recalibration of office-use patterns by large institutional tenants. As lease expiries have come due since 2022, many large occupiers have reduced their total floorspace footprint but upgraded the quality of their accommodation — moving from B-Grade or A-Grade to Premium where feasible, accepting lower square metres in exchange for better amenity, natural light, end-of-trip facilities, and proximity to transit and services.
The result is that premium supply has been progressively absorbed even as total market vacancy has remained elevated, while secondary grade stock accumulates unoccupied space.
The JLL Sydney Office Market Dynamics Q1 2026 report confirms this trend, noting the CBD as the primary source of positive demand while non-CBD markets remain challenged.
Rental Outlook for 2026
The outlook for office rents in 2026 is cautiously positive for prime assets, with Sydney CBD forecast to achieve net effective rent growth of approximately 6.6% in 2026, driven primarily by the absorption of premium and upper-A-Grade stock and the absence of new office completions during the year.
No new Sydney CBD office developments are scheduled to complete in 2026, which should continue to stabilise vacancy at the premium end through H1 2026.
Vacancy is expected to tick up again through H2 2027 and into 2028, when over 175,000 sqm of new CBD office space currently under construction is due to complete.
The development pipeline is therefore creating a defined window of relative supply constraint at the premium end of the market through 2026. Tenant CS’s Q1 2026 Australian CBD leasing snapshot provides detailed sub-precinct data on available space and incentive levels across Sydney and other capitals.
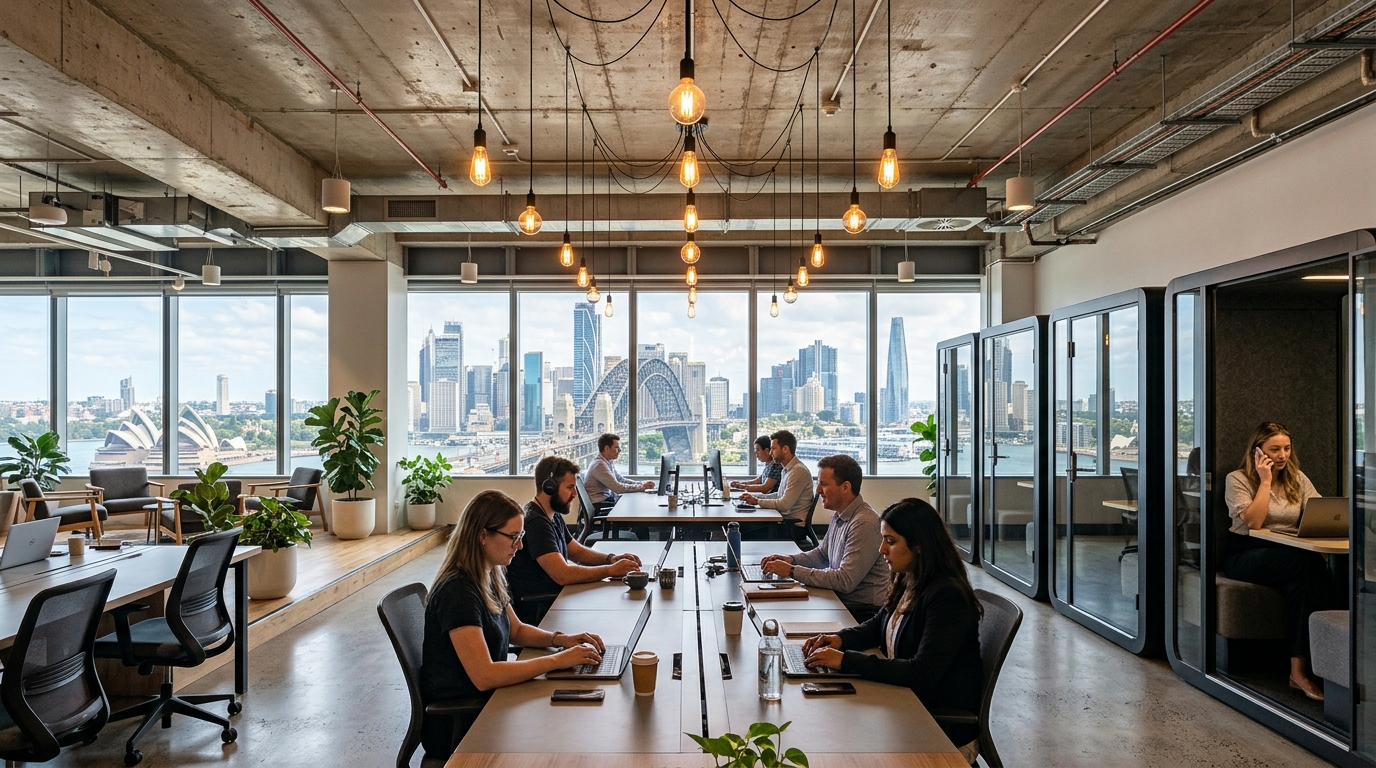
This flight-to-quality pattern is visible on the ground across premium office precincts.
Premium co-working operators are among the tenants capturing this demand.
Industrial and Logistics, the Tightest Sector
Industrial and logistics property remains the most sought-after commercial asset class in NSW in 2026, supported by structurally low vacancy, a supply pipeline with healthy pre-commitment rates, and the unprecedented demand catalyst of Western Sydney Airport opening to cargo in July 2026 and passengers in October 2026.
JLL forecasts moderate rental growth of 2.5%–3.0% over the next 12 months for prime industrial assets in Sydney, with capital value improvement expected as yield compression continues through 2026.
Industrial and logistics yields are stable at 5.25%–6.50%, and institutional investment volumes in the sector reached $6.7 billion in 2025 — well above long-term averages — with the sector remaining the top-ranked commercial asset class by institutional capital allocation preference for 2026.
Sydney’s 2026 Industrial Supply Pipeline
Sydney’s industrial and logistics market is entering a new supply cycle in 2026, with approximately 1,385,700 sqm of new warehouse space forecast for completion over the next 12 months.
The critical context is that approximately 58% of this space is already pre-committed, giving a pre-leased stock level that is well above the threshold typically considered healthy for managing oversupply risk.
Prime rents have largely stabilised since mid-2024 and remain significantly above pre-pandemic levels, with face rents holding firm and market adjustment occurring primarily through incentive levels rather than headline rates. Colliers’ The Industrialist analysis of the Western Sydney market in May 2026 describes the sector as entering “a more balanced phase” after several years of rapid growth, but one that still offers significant structural upside from the airport opening.
Western Sydney Airport and Aerotropolis Demand
The Western Sydney Airport is already generating freight and logistics pre-commitments in the Aerotropolis precinct. Operators are committing to sites they will not occupy for 18–24 months. This forward-booking behaviour reflects a clear recognition among major logistics operators.
Strategic positioning near the new airport represents a decade-long competitive advantage. The Aerotropolis Enterprise Zone covers the area immediately surrounding Badgerys Creek. It is zoned specifically for airport-related industries, including air freight, aerospace, advanced manufacturing, and logistics.
It creates a distinct sub-market within the broader Western Sydney industrial corridor. This sub-market is attracting a qualitatively different mix of occupiers than traditional warehousing nodes.
Australia Develops’ guide to the Western Sydney Aerotropolis in 2026 provides detailed coverage of this precinct.
Aerotropolis precinct land banking has entered its execution phase. Logistics operators and institutional investors are extending their footprint into the adjoining Leppington development pipeline as the broader South West Growth Area matures.
Several structural milestones are converging across the Western Sydney industrial corridor through 2026.
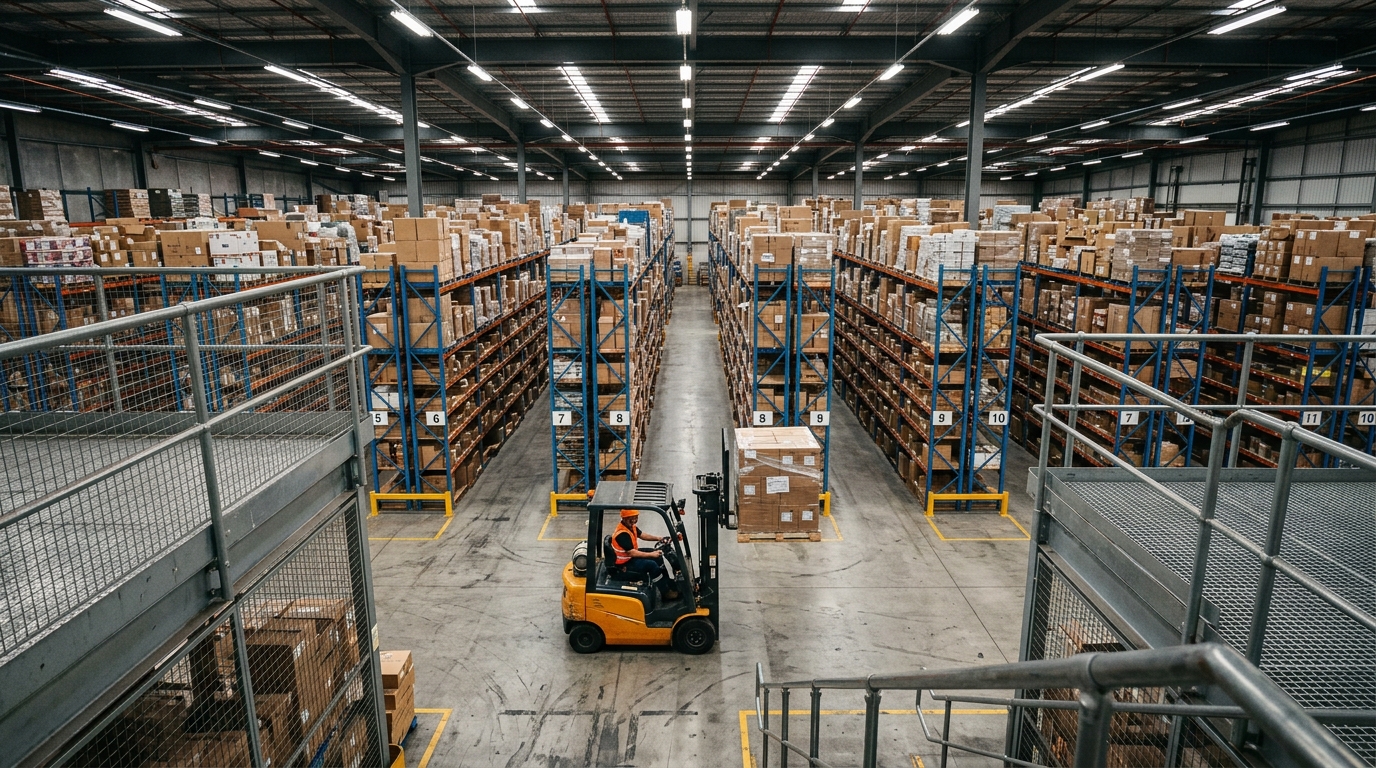
These milestones are reshaping day-to-day operations across the precinct’s logistics facilities.
The supply and rental figures below quantify the scale of this expansion.
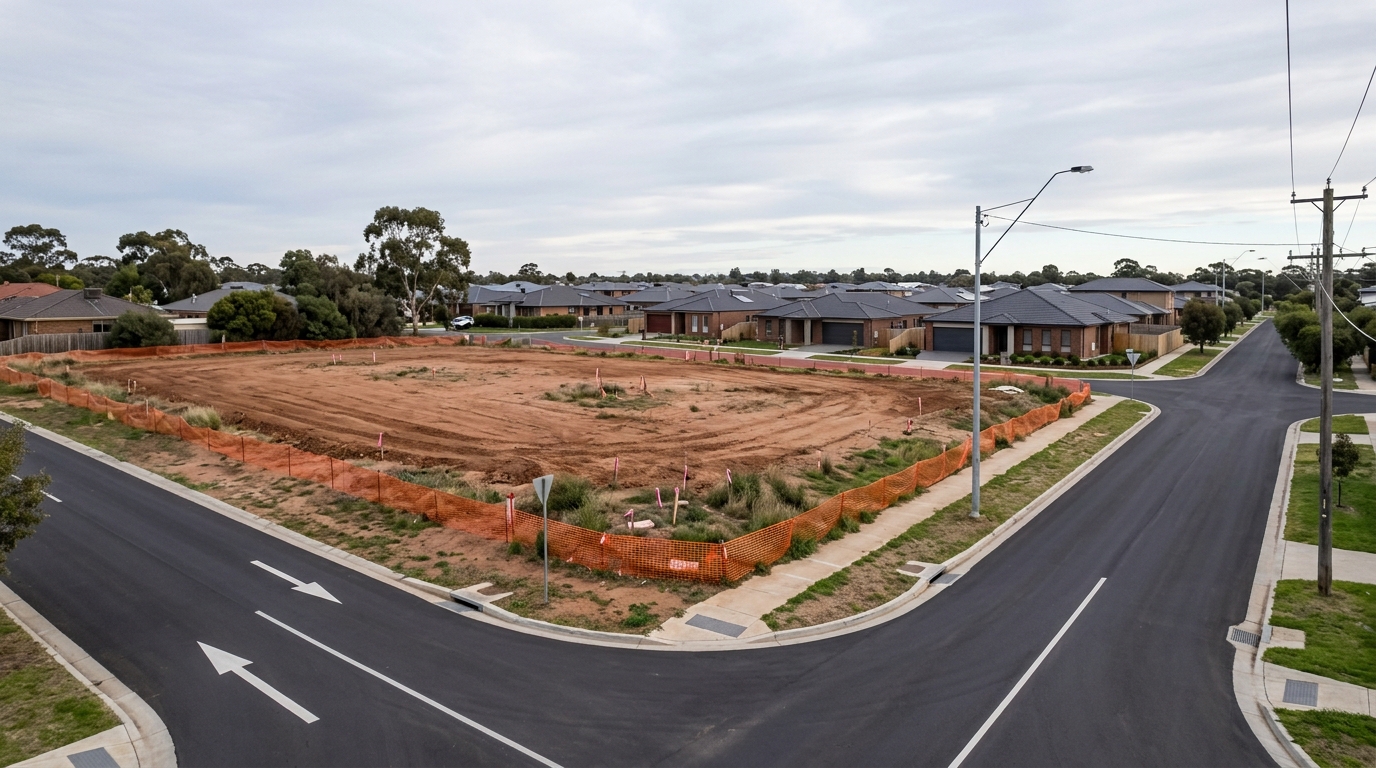
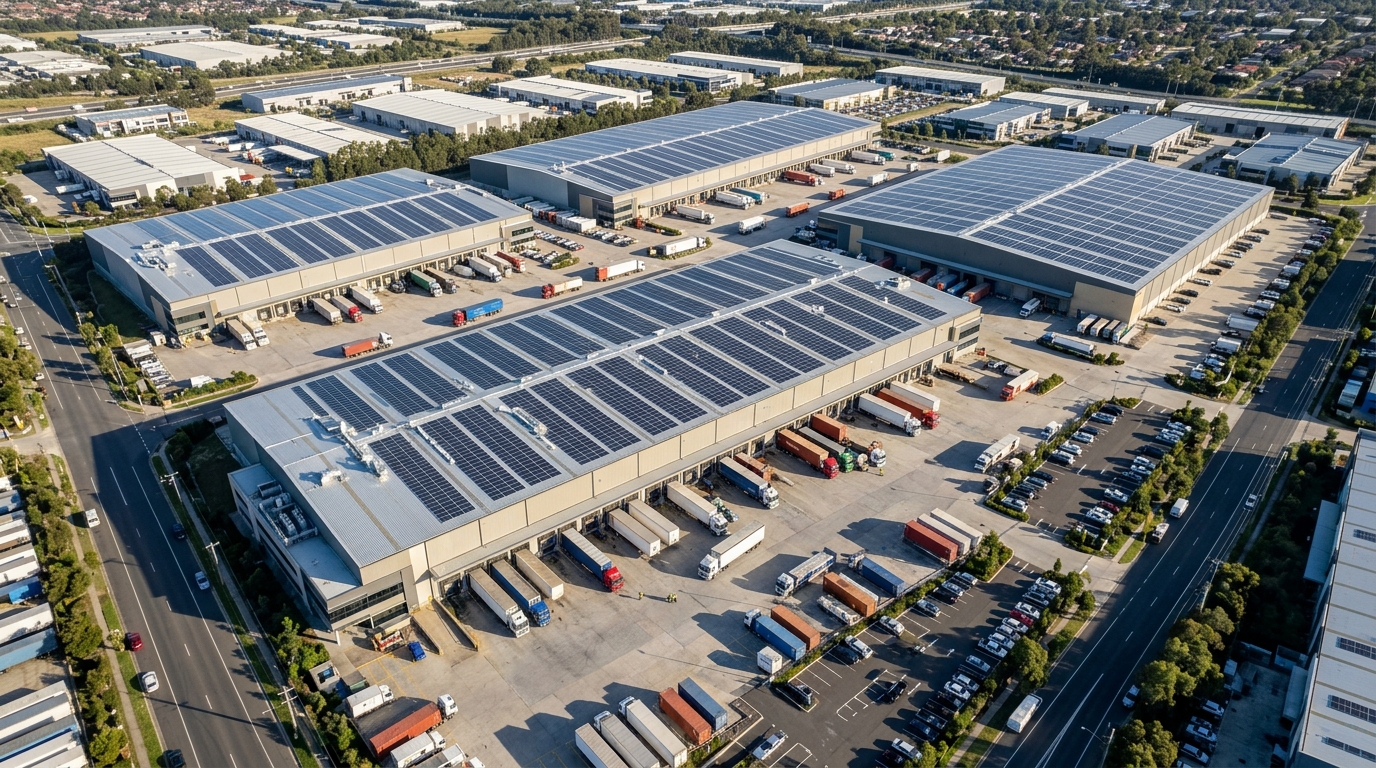
The aerial view below captures the scale of new industrial estates delivering this supply.
Why Retail Formats Are Diverging
Sydney’s retail property market is the standout performer among Australian capital city retail markets in 2026, recording the lowest overall vacancy rate of 3.9% across all retail asset sub-sectors nationally.
This headline figure reflects a market that has largely absorbed the structural adjustments of post-pandemic retail leasing — the rationalisation of department store anchor tenancies, the repositioning of mid-size retailers, and the recalibration of foot traffic patterns between CBD and suburban formats.
Neighbourhood and convenience-based centres continue to outperform all other retail formats, benefiting from their non-discretionary focus (supermarkets, medical, personal services), strong local catchments, and the sustained population growth in Western Sydney and south-western growth corridors. Real Estate Asia’s analysis notes that neighbourhood centres and large-format retail projects dominate Sydney’s 2026 development pipeline.
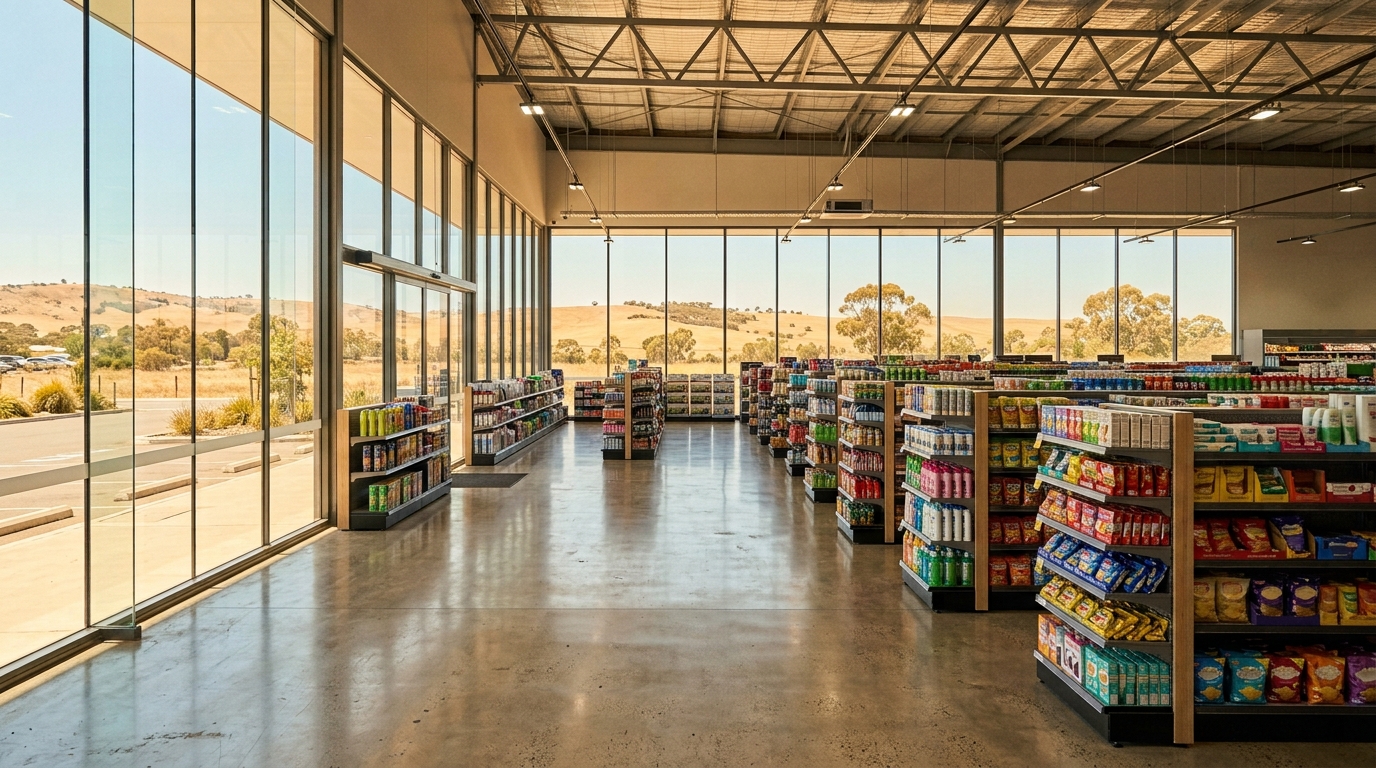
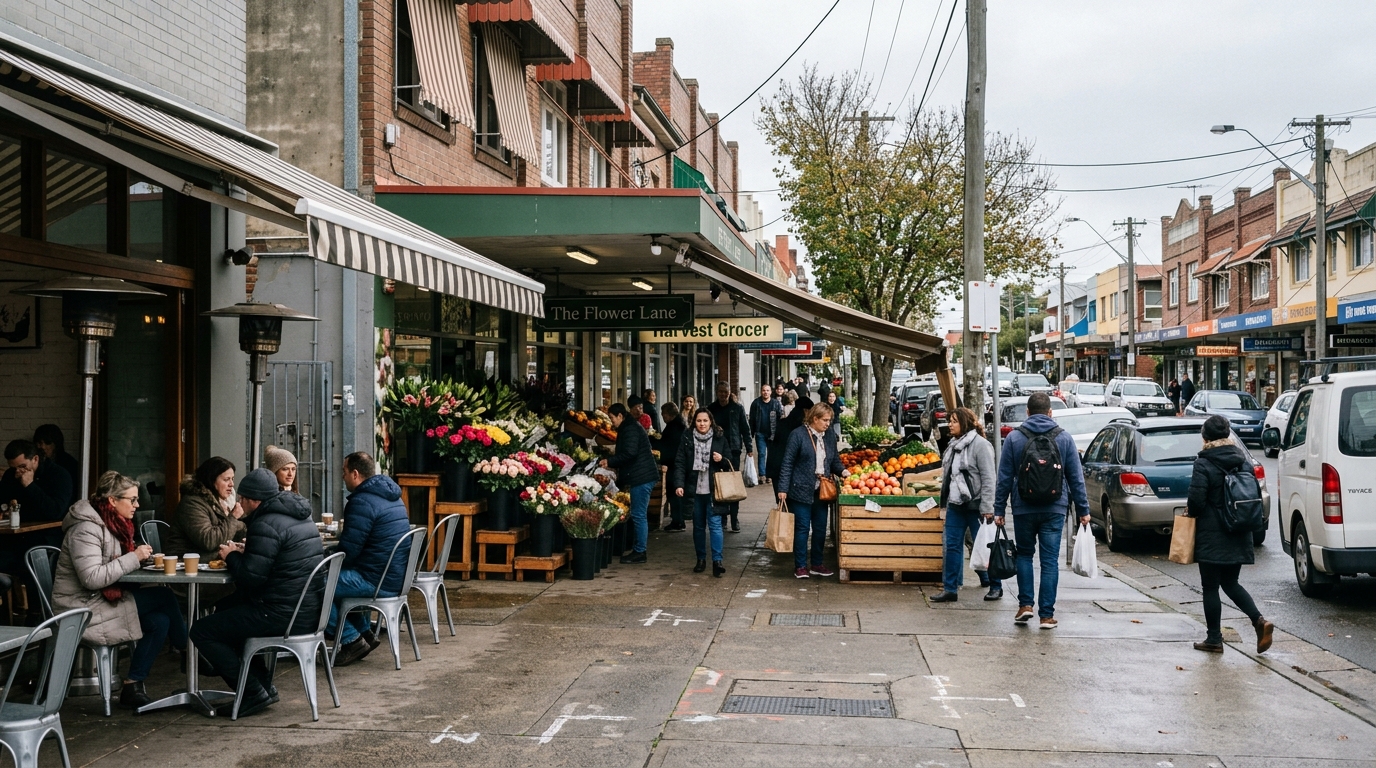
This performance is visible at street level across well-located retail strips.
This strength is reflected in gross rent growth across sub-sectors, detailed below.
Retail Rental Growth and Format Divergence
Gross rents increased across all retail sub-sectors during Q1 2026, with growth ranging from 0.5% to 2.0%. Large format retail recorded the strongest rental growth for the second consecutive quarter, rising 2.0%, supported by constrained supply of quality large-format retail sites and sustained demand from hardware, homewares, and bulky goods retailers who have benefited from sustained residential construction activity across Western Sydney.
Shopping centre rents are forecast to rise mid-single digits in 2026, with vacancy remaining below 5% across the category — development costs and land prices are constraining new supply in a way that maintains market tension between demand and available space. CBRE’s Australian Shopping Centres Outlook 2026 provides detailed analysis of the asset class dynamics driving this performance.
The retail market’s divergence between formats is significant for planning and development decisions. Prime strip retail in high-income catchments — Double Bay, Paddington, Mosman, Newtown, and comparable precincts — continues to command exceptionally low capitalisation rates of 3.5%–4%.
This reflects the scarcity of quality street-level retail tenancies and the stability of catchment demographics in these locations. Secondary retail and CBD non-anchor tenancies remain the weakest performers in the market.
They face elevated vacancy pressure and ongoing repositioning requirements. The bifurcation between essential-services-anchored and discretionary retail formats is likely to persist through 2026 and beyond. Colliers’ Q1 2026 Retail Snapshot provides precinct-by-precinct data on vacancy and rental movement.
Neighbourhood centres in growth corridors such as the Bankstown CBD precinct continue to outperform legacy suburban malls as population catchments expand.
Investment Volumes and Where Cap Rates Sit
NSW captured 43.1% of all national commercial real estate transactions in 2024–25. This underscores how institutional investment infrastructure commitments continue to concentrate in Sydney relative to other Australian capitals.
It reflects the depth and liquidity of the market and sustained international capital appetite. Foreign investment reached $9.3 billion in 2025, up 12% year-on-year.
North American private equity and Singaporean, Korean, and Japanese institutional funds were among the most active acquirers of prime NSW assets.
The dominant theme in the institutional investment market for 2026 is “returning liquidity.” Indeed, after a period of elevated uncertainty around interest rates and asset repricing, the RBA’s rate-cutting cycle from mid-2025 is restoring investor confidence. Cushman & Wakefield’s 2025 EOY commentary and 2026 forecast describes liquidity as the key driver in 2026.
Deeper capital pools and more competitive bid processes are expected to support a strong rebound in transaction volume.
Capitalisation Rate Trends by Asset Class
Commercial real estate yields across the NSW market in 2026 reflect a stark hierarchy of investor preference. Capitalisation rate ranges diverge sharply by asset class. Prime strip retail in high-income locations (3.5%–4.0%) remains the tightest-yielding commercial asset in NSW.
Sydney CBD prime office follows at 4.0%–5.0%. Meanwhile, industrial and logistics assets in Western Sydney and the Port Botany corridor sit at 5.25%–6.50%. Suburban office and large-format retail assets command higher yield requirements of 6.0%–7.5%.
This reflects higher vacancy risk and the capital expenditure needed to maintain or reposition secondary-grade assets. Yield compression is expected to be selective through 2026 — primarily in industrial, prime retail, and premium office.
Similar yield compression dynamics are shaping land value expectations in emerging corridors such as the Austral Precinct, where industrial and logistics land banking continues to accelerate. CBRE’s Pacific Real Estate Market Outlook April 2026 provides the most comprehensive institutional-grade analysis of yield movement expectations.
Capitalisation rate ranges vary widely by NSW commercial asset class in 2026.
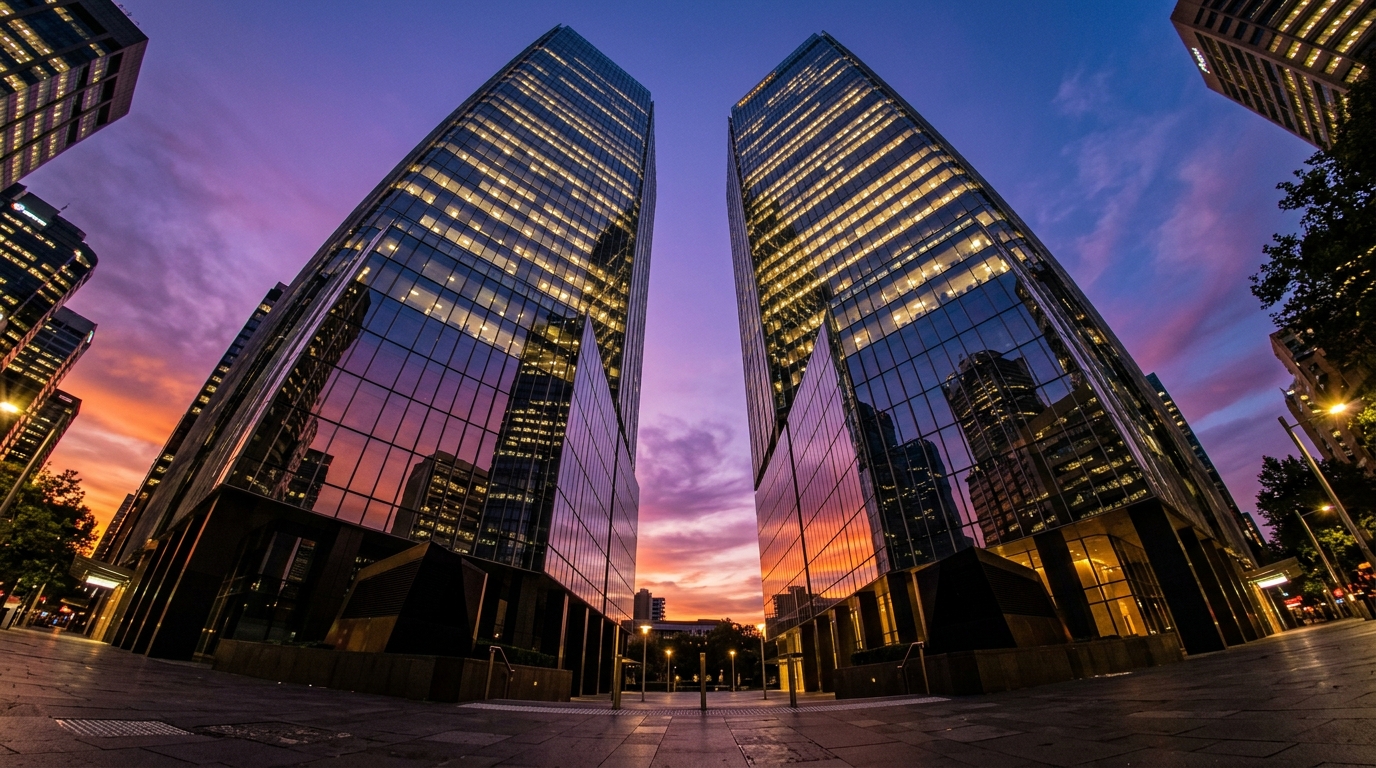
This cap rate hierarchy is reflected in the assets institutional investors are targeting, such as premium office towers.
The transaction figures below quantify the scale of this institutional capital flow.
NSW Commercial Real Estate in Numbers
| Metric | Figure |
|---|---|
| Sydney CBD Overall Office Vacancy (Jan 2026) | 13.8% |
| Premium CBD Office Vacancy (Jan 2026) | 8.9% (down from 10.9%) |
| A-Grade CBD Office Vacancy (Jan 2026) | 16.6% (down from 17.6%) |
| B-Grade CBD Office Vacancy (Jan 2026) | 16.0% (up from 14.4%) |
| All Sydney Markets Office Vacancy | 21.5% |
| Sydney CBD Office Rent Growth Forecast 2026 | +6.6% net effective |
| New CBD Office Completions 2026 | Nil (supply holiday) |
| Industrial & Logistics Yields (NSW) | 5.25%–6.50% (stable) |
| Industrial Rental Growth Forecast (12 months) | 2.5%–3.0% |
| Sydney Industrial Supply Pipeline (12 months) | 1,385,700 sqm (58% pre-committed) |
| Industrial Investment Volume 2025 | $6.7 billion (above long-term avg) |
| Sydney Retail Vacancy (all sub-sectors) | 3.9% (lowest nationally) |
| Large Format Retail Rent Growth (Q1 2026) | +2.0% |
| Shopping Centre Rent Growth Forecast 2026 | Mid-single digits |
| NSW Share of National Commercial Transactions | 43.1% (2024–25) |
| Foreign Investment in NSW Commercial (2025) | $9.3 billion (up 12%) |
Summary: What NSW Commercial Real Estate 2026 Means for Occupiers
NSW commercial real estate in 2026 is rewarding quality, location, and sector selection above all else. Industrial and logistics assets, particularly in Western Sydney and along established freight corridors, remain the dominant investment and development opportunity in the state, with the airport opening providing a decade-long structural demand tailwind that is already manifesting in pre-commitment activity.
Retail, concentrated in neighbourhood centres and essential-services formats, is delivering its strongest fundamental conditions in years, with low vacancy and consistent rental growth reflecting the sector’s success in adapting to changed consumer behaviour and concentrated population growth in the city’s south-west.
Office is the most complex sector to navigate — the flight to quality is creating real opportunities in premium CBD space, but secondary and suburban office assets face a multi-year repositioning challenge that will require either capital investment to upgrade amenity or conversion to alternative uses.
The summary below distills the key 2026 takeaway for each NSW commercial asset class.
What This Means for Developers and Occupiers
The returning institutional liquidity in the NSW commercial market — driven by the RBA’s rate-cutting cycle and sustained foreign capital inflows — is beginning to compress yields at the prime end of all three asset classes.
Developers and occupiers who can access well-located industrial land in Western Sydney, secure neighbourhood retail tenancies in growth corridors, or position in premium CBD office space at current effective rents are likely to find themselves advantageously positioned as the broader commercial market recovery deepens through 2026 and 2027.
For the development context driving demand in Western Sydney’s commercial precincts, see Australia Develops’ coverage of Liverpool City Centre rezoning and the Campbelltown–Macarthur development corridor.
Frequently Asked Questions
What is the office vacancy rate in Sydney CBD in 2026?
Sydney CBD office vacancy reached 13.8% as at January 2026, the highest level in approximately 30 years, though premium-grade space is tightening as tenants pursue a flight to quality.
Why are NSW industrial and logistics yields so tight?
Industrial and logistics yields are stable at 5.25–6.50%, supported by structurally low vacancy, a pre-committed supply pipeline, and $6.7 billion in institutional investment during 2025.
Which NSW retail format is performing best in 2026?
Neighbourhood and convenience-based retail centres are outperforming, contributing to Sydney’s overall retail vacancy rate of 3.9%, the lowest of any Australian capital city.
How much foreign investment did NSW commercial real estate attract in 2025?
NSW attracted an estimated $9.3 billion in foreign commercial real estate investment in 2025, up 12% year-on-year, capturing 43.1% of all national commercial transactions.
This article is for general informational purposes only and does not constitute financial, investment, or legal advice. Seek independent professional advice before making property decisions. See our Disclaimer for details.